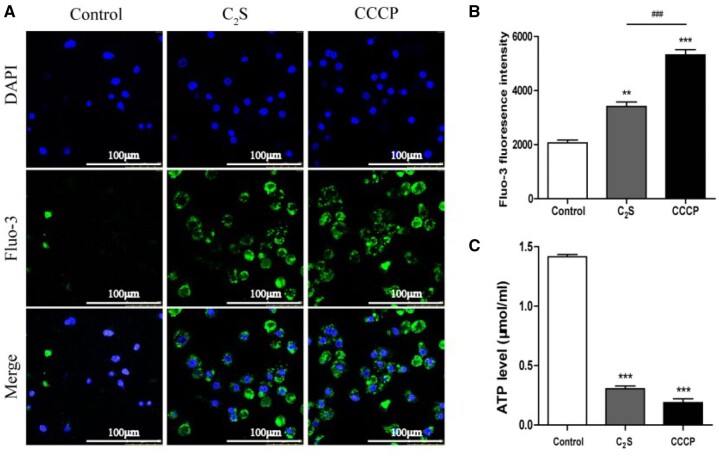
Figure 5.
C2S enhanced intracellular calcium levels and reduced ATP production in macrophages. (A) Representative fluorescence microscopy images of Flu-3 stained, macrophages. (B) Quantitative analysis of Fluo-3-stained macrophages by flow cytometry analysis. (C) Quantitative measurements of ATP level in macrophages. Data are presented as mean±SD, n = 3. Significant effect of the treatment: compared with the control group, **P < 0.01, ***P < 0.001, compared with the positive control group (CCCP), ###P < 0.001

