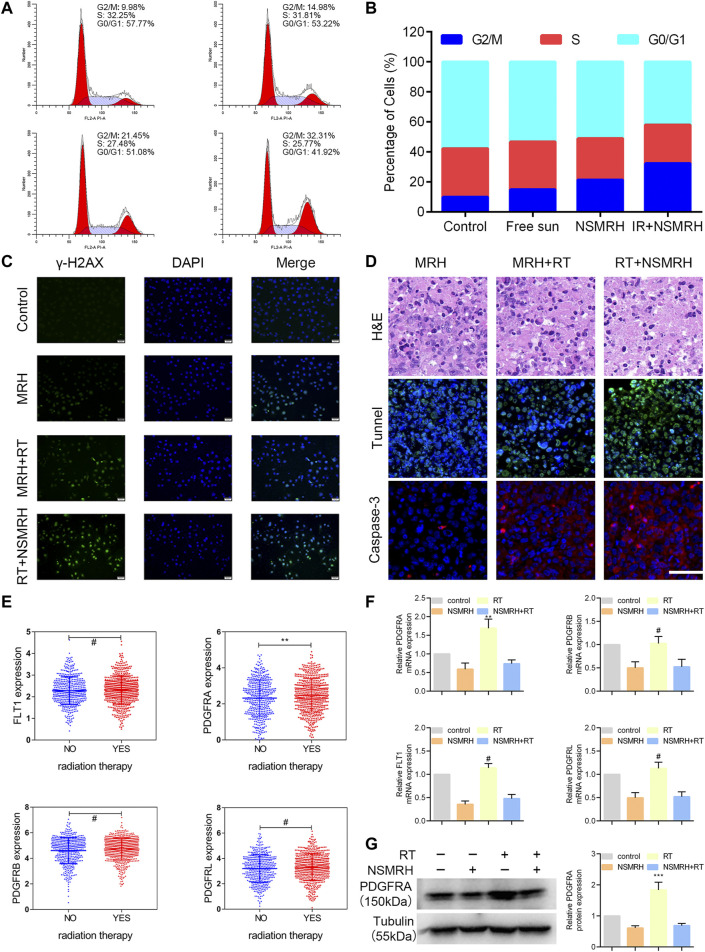
FIGURE 5.
Analysis of the possible mechanism of NSMRH. (A, B) NSMRH combined with RT induces G2/M checkpoint of MM-231 cells. FFlowcytometricanalysis of the DNA content in four groups cultured for 24 h. Pictures were representative flow cytometry plots of three experiments. (C) NSMRH impairs DSB repair after irradiation in MM-231 cells. DSB repair assay was performed by counting phospho γ-H2AX foci. DSBs were stained as green and the nuclei as blue, 200 ×, scale bars: 50 μm. (D) Tunnel and Caspase-3 expression in original orthotopic tumors, as determined by IHC staining analysis. Each inset shows images obtained at × 100magnification, scale bars: 25 μm. (E) The mRNA level of PDGFRA, FLT1, PDGFRB, and PDGFRL were analyzed in the TCGA dataset. (F) Relative mRNA expression of PDGFRA, PDGFRB, FLT1, PDGFRL, and GAPDH was detected using RT-qPCR in different treatments. (G) Left, the protein level of PDGFRA, FLT1, PDGFRB, and PDGFRL were examined by western blot assay; Right, quantification of the grayscale analysis in three independent experiments.

