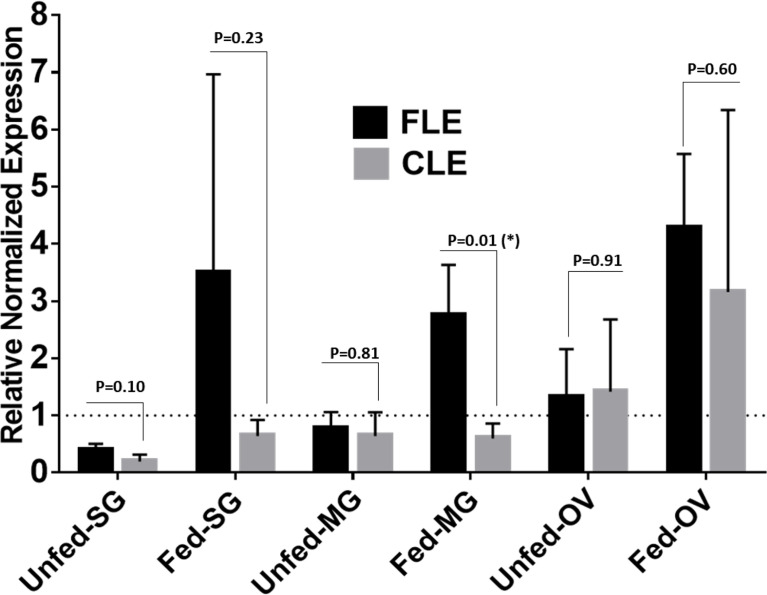
Figure 10.
qPCR-based relative quantification of FLE and CLE in field-collected tick tissues (salivary gland, midgut and ovary) from Delaware. All the expressions shown are relative to actin. Expression of actin has been shown as 1 (dotted line). Statistically significant comparisons are indicated by *p ≤ 0.05). SG, salivary gland; MG, midgut; OV, ovary.

