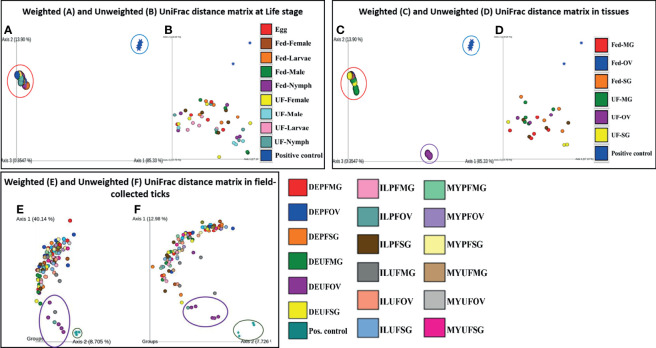
Figure 5.
Beta diversity metrics. Emperor plot of PCoA analysis of the weighted and unweighted UniFrac distance matrix across (A, B) different life stage and (C, D) tissues of lab raised ticks. Representative PCoA analysis of (E) weighted and (F) unweighted UniFrac distance matrix from field-collected ticks. Each colored ellipse corresponds to uniquely clustering patterns of biological replicates. Each point represents the bacterial microbiome of an individual tick or dissected tissue. UF-unfed, PF-partially fed, SG-salivary gland, MG-midgut, OV-ovary, DE-Delaware, IL-Illinois, MY-Maryland.

