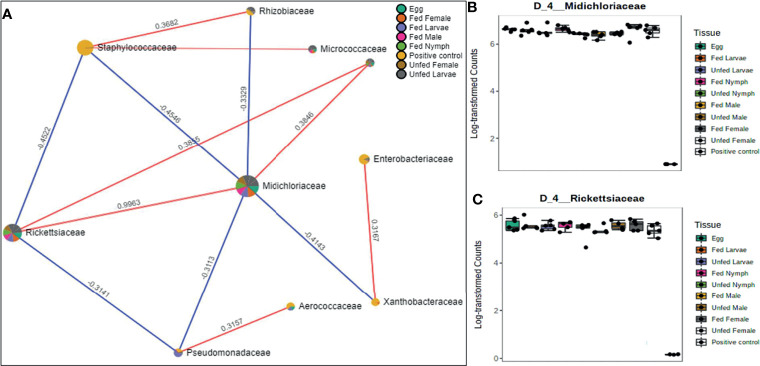
Figure 6.
Correlation network analysis in different life stages of laboratory-raised Amblyomma americanum ticks. Correlation network generated using the SparCC algorithm. Correlation network with nodes representing taxa at the family level and edges representing correlations between taxa pairs (A) and representative box plots showing enriched abundance of Midichloriaceae (B), and Rickettsiaceae (C) across all samples.

