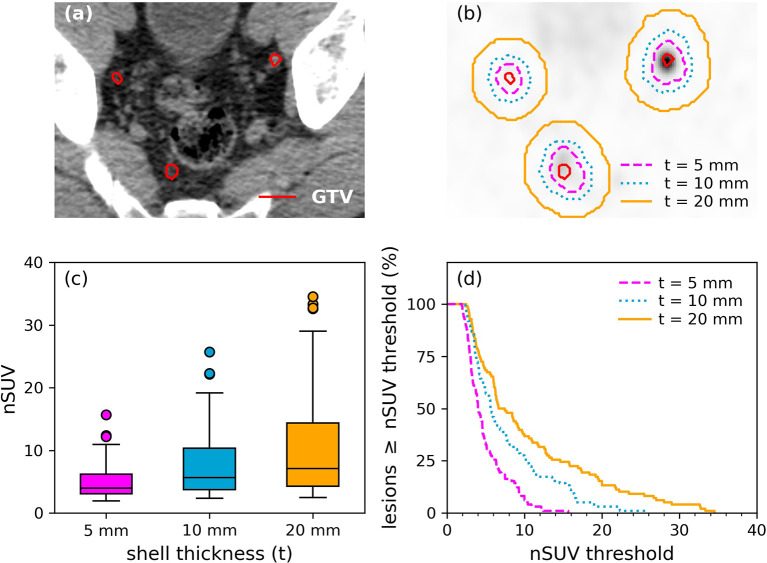
Figure 2.
Illustration of lesions for a patient. (A) GTVs (red) were segmented on the CT component while (B) outer shell expansion was performed on the PET component. Outer shells resulting from a margin expansion of 5 mm/10 mm/20 mm are shown. (C) Distribution of nSUV by using an outer shell margin expansion of 5 mm/10 mm/20 mm. (D) Cumulative probability distribution function of lesions having nSUV greater or equal to an nSUV threshold as a function of the nSUV threshold. Results inside a shell thickness of 5/10/20 mm are shown.

