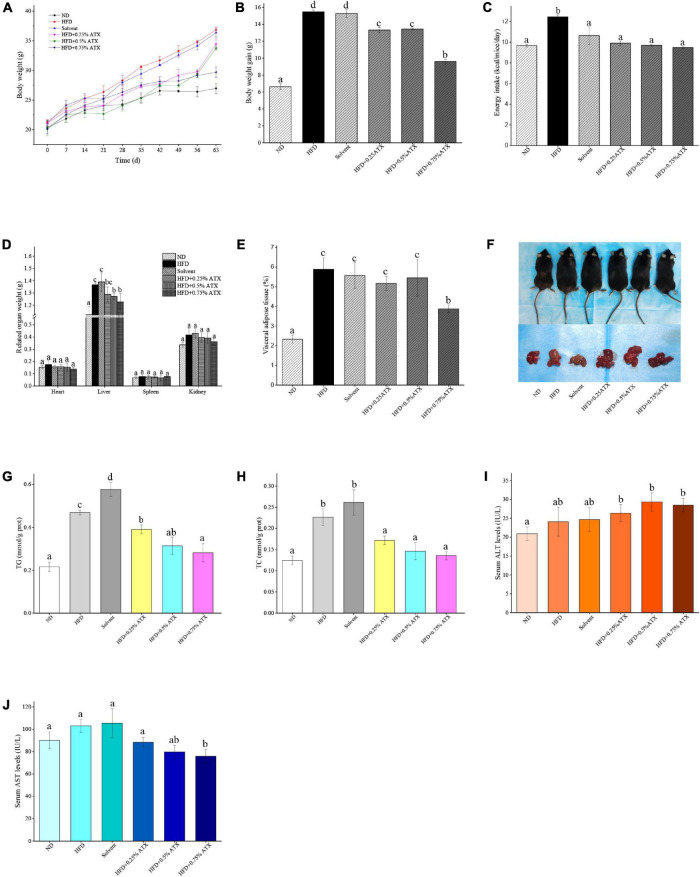
FIGURE 1.
Astaxanthin (ATX) prevented obesity and related indices in HFD-fed mice. (A) Body weight. (B) Body weight gain. (C) Energy intake. (D) Related organ weight. (E) Visceral adipose tissue. (F) Visual appearance pictures of metabolic mice and liver. (G) Hepatic TG level. (H) Hepatic TC level. (I) Serum ALT level. (J) Serum AST level. Values are expressed as mean ± SD of triplicate (n = 6). The different letters (a–d) indicate significant differences (P < 0.05) according to Duncan’s multiple range test in ANOVA.

