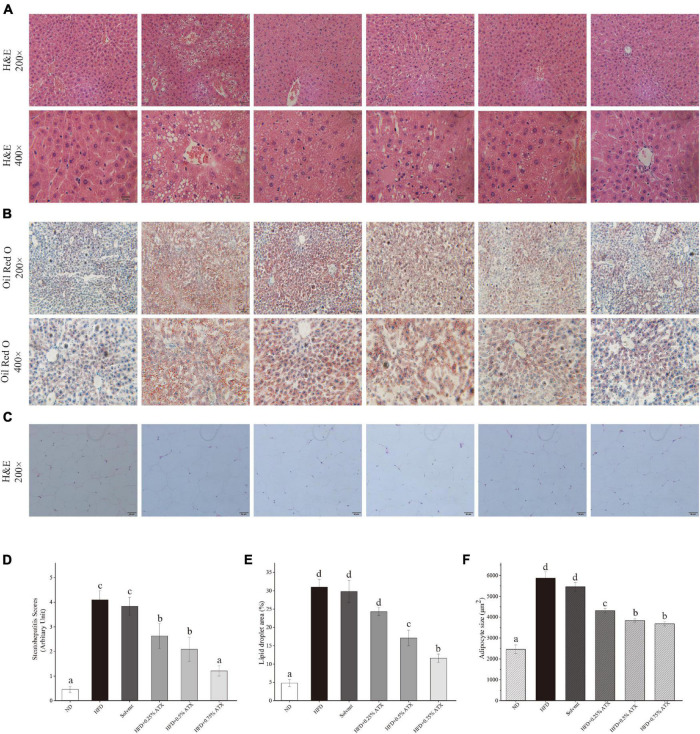
FIGURE 3.
Pathological changes of ATX on liver and epididymal fat in HFD-induced mice. (A) Liver sections stained with HE (200×, 400×). (B) Liver sections stained with Oil red O (200×, 400×). (C) HE-stained e-AT sections (200×). (D) Steatohepatitis scores. (E) Percentage of the lipid droplet area assessed by Oil red O staining. (F) Mean cell area of adipocyte in e-AT. Values are expressed as mean ± SD of triplicate (n = 6). The different letters (a–d) indicate significant differences (P < 0.05) according to Duncan’s multiple range test in ANOVA.

