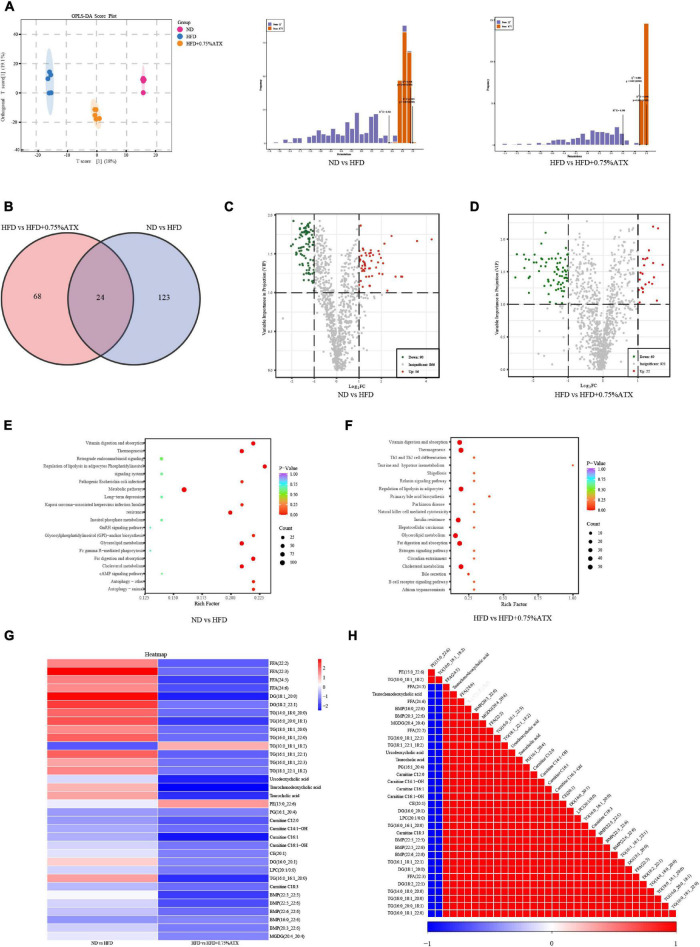
FIGURE 5.
Astaxanthin regulated lipid metabolites in HFD-fed mice. (A) OPLS-DA score plot (left) and permutation plot (right). (B) Venn diagram depicting the overlap of significantly changed metabolites between experimental groups. The volcano plot analysis of ND vs. HFD group (C) and HFD vs. HFD + 0.75% ATX group (D). Analysis of lipid metabolism pathway of ND vs. HFD (E) and HFD vs. HFD + 0.75% ATX (F). (G) Heatmap of 34 significantly altered metabolites in ATX-treated HFD-fed mice. Blue: downregulated metabolites. Red: upregulated metabolites. (H) The associated heatmap of significantly changed metabolites.

