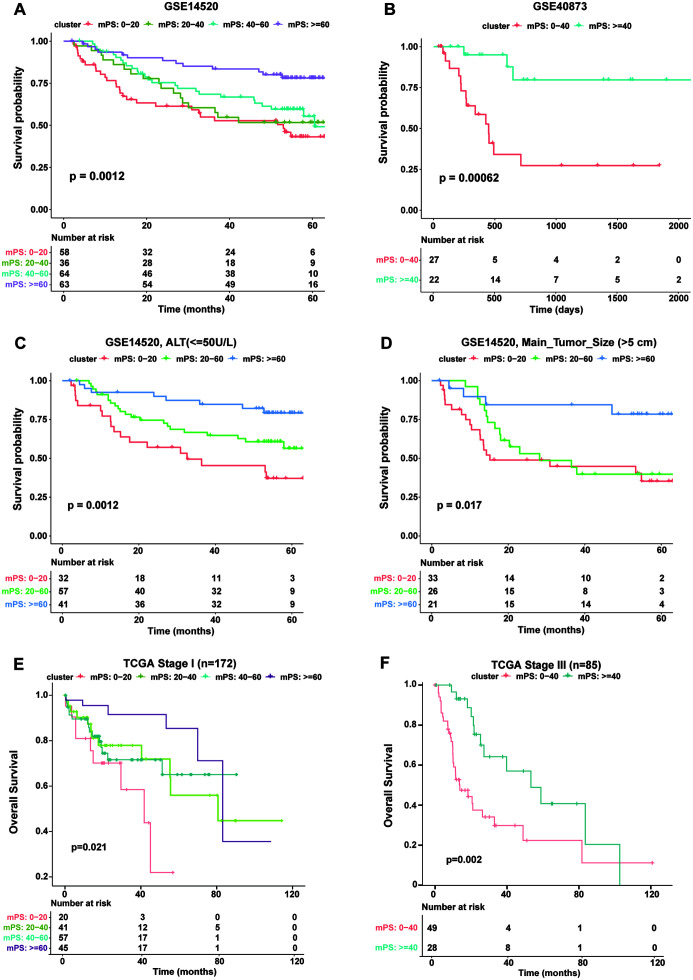
Fig. 5. The mHPS predicts prognosis of independent HCC cohorts.
(A) K-M curves of OS for the public dataset GSE14520 according to the mHPS. (B) K-M curves of OS according to the mHPS for the public dataset GSE40873. (C) K-M curves according to mHPS for OS of patients in the GSE14520 dataset with serum ALT level lower than 50U/L. (D) K-M curves according to mHPS for OS of patients in the GSE14520 dataset with the main tumor size larger than 5 cm. (E and F) K-M curves according to mHPS for OS of patients in the TCGA cohorts at clinical TNM stage I (E) and stage III (F). K-M curves, Kaplan-Meier curves; ALT, Alanine aminotransferase; BCLC, TNM, tumor node metastasis classification; mHPS, molecular hepatocellular carcinoma prognostic score; OS, overall survival; TCGA, The Cancer Genome Atlas.

