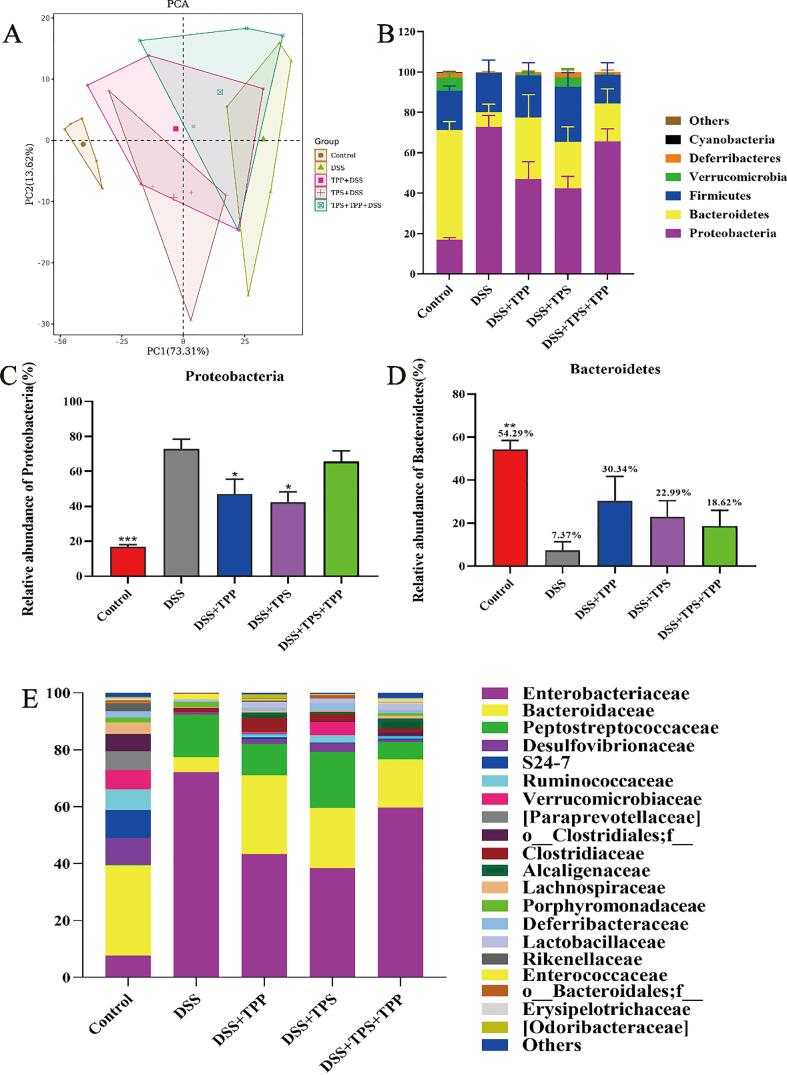
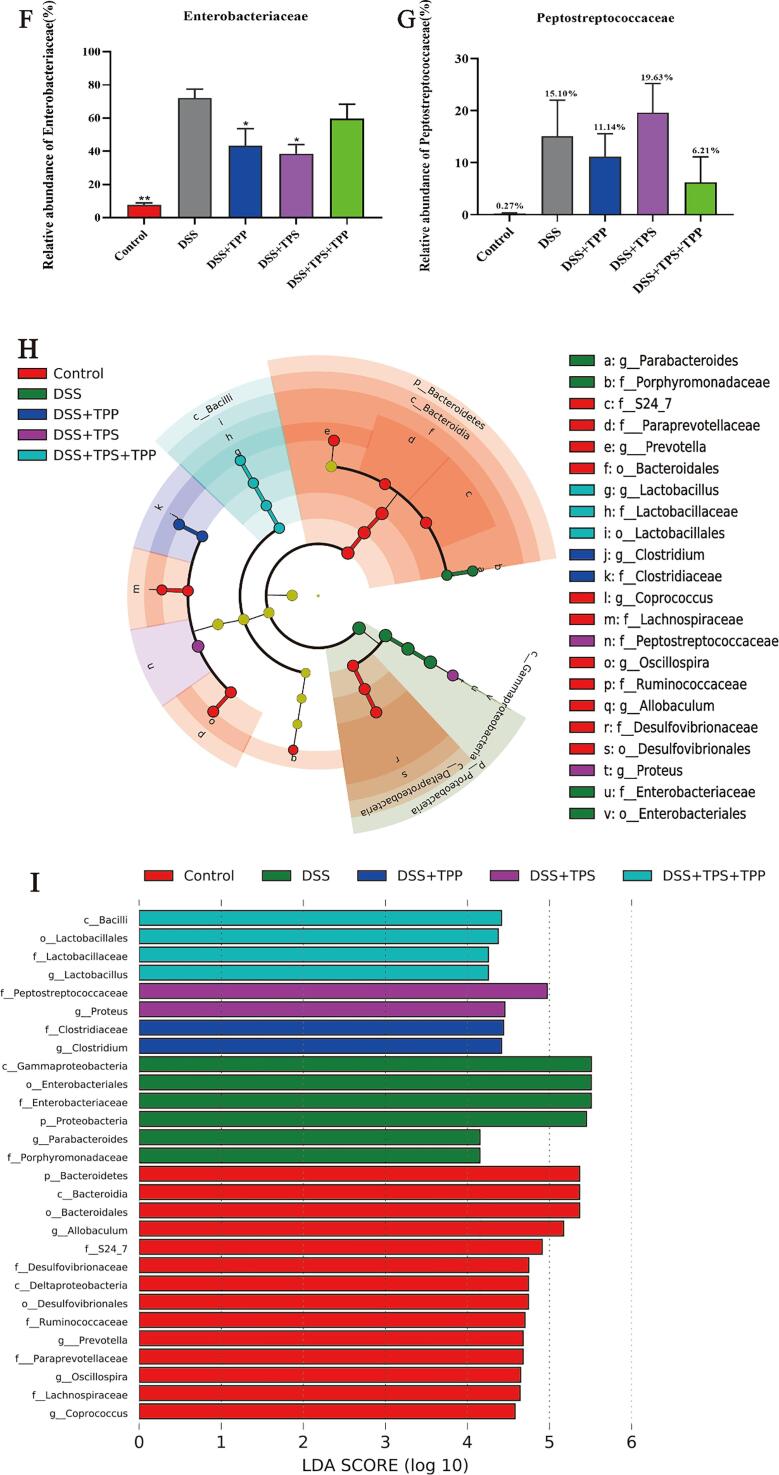
Fig. 5.
Beta diversity, composition and LEfSe of gut microbiota in different groups. (A) PCA analysis; (B) Gut microbial compositions at phylum level; (C) Relative abundances of Proteobacteria; (D) Relative abundances of Bacteroidetes; (E) Gut microbial compositions at family level; (F) Relative abundances of Enterobacteriaceae; (G) Relative abundances of Peptostreptococcaceae; (H) Taxonomic cladogram generated from default LEfSe analysis; (I) LDA scores of the differentially abundant taxa (with a LDA score of > 2 and a significance of α < 0.1) (n = 5). Data are expressed as the mean ± SEM. *p < 0.05, **p < 0.01, ***p < 0.001 were compared with the DSS group.


