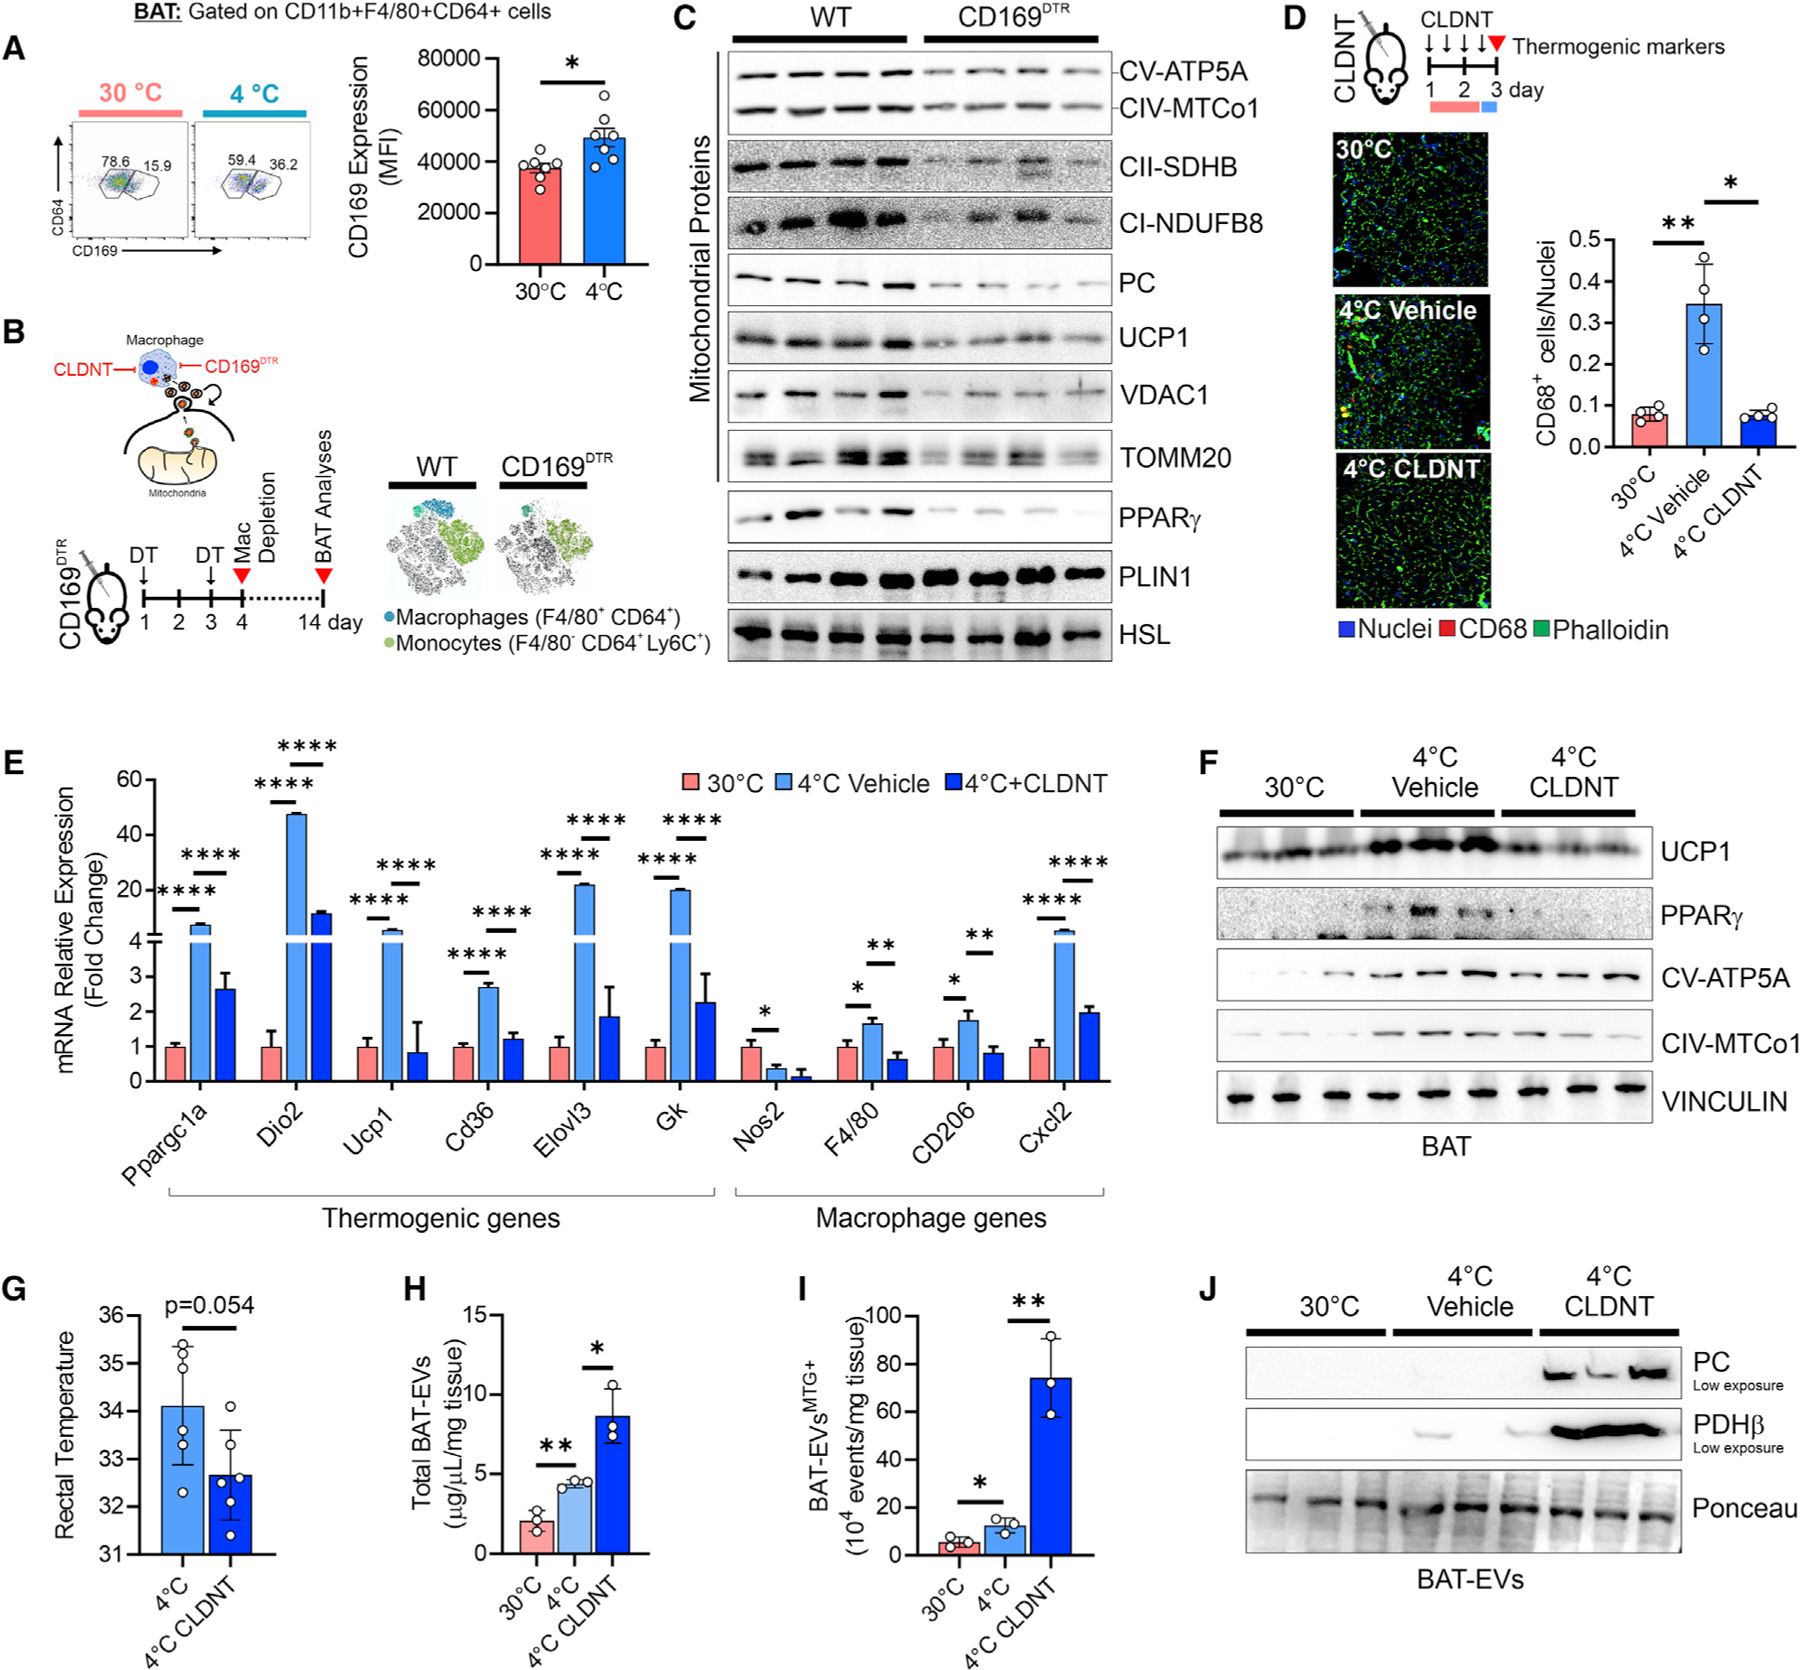
Figure 6. Macrophages control the thermogenic capacity of BAT.

(A) Flow cytometry density plot and quantitation of CD169+ bMACs. Student’s t test, *p < 0.05, n = 7 mice/group.
(B) Experimental design and t-SNE map of antigen redistribution in BAT of WT and CD169DTR mice 4 days after DT injection.
(C) Immunoblots of BAT from WT and CD169DTR mice 14 days after DT injection. HSL was used as loading control (n = 4 mice/group).
(D) Experimental design and representative fluorescence micrographs of BAT stained with the CD68 antibody (red) to detect bMACs. Quantification of CD68+ bMACs is reported (right panel). ANOVA, *p < 0.05, **p < 0.01, n = 4 mice/group.
(E–G) qPCR (E), immunoblot (F) of BAT and rectal temperature (G) of mice at 30°C and 4°C. Mice were pre-treated with liposome clodronate (CLDNT) prior to cold exposure. ANOVA, *p < 0.05, **p < 0.01, ****p < 0.001; n = 3 or n = 6 mice/group.
(H and I) Flow-cytometry quantitation of total EVs (H) and MTG+ EVs (I) released from BAT. Student’s t test, *p < 0.05, **p < 0.01; n = 3 mice/group.
(J) Representative iunoblots of BAT EVs. Ponceau was used as loading control (n = 3 mice/group). See also Figure S6.
