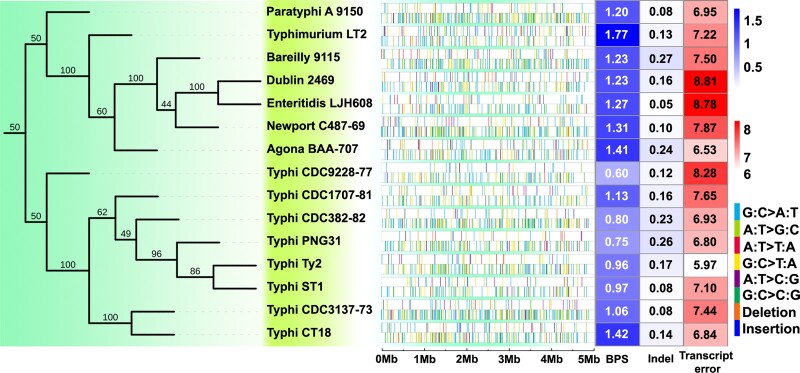
Fig. 1.
Rates and distribution of mutations and transcript errors of the 15 MMR-functional Salmonella enterica strains. (Left) The phylogenetic relationship of the strains based on whole-genome SNPs. (Center) The genome-wide distribution of mutations for each strain (the upper row with sparse colored bars) and transcript errors (the lower row with dense colored bars). (Right) Heat map showing for each strain BPS mutation rates × 10−10 per site per generation; indel mutation rates × 10−10 per site per generation; and transcript-error rates × 10−6 per site per transcription.

