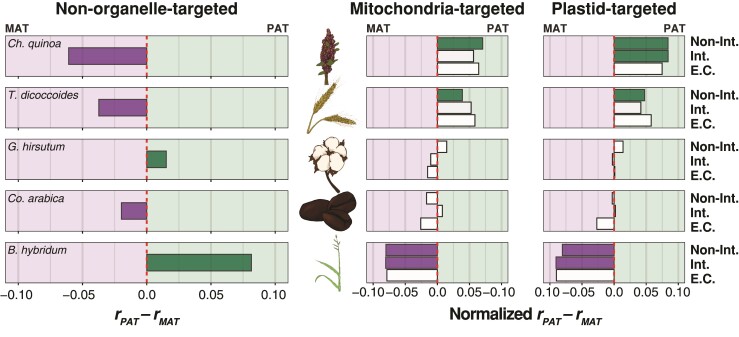
Fig. 3.
Gene content bias across allotetraploid subgenomes. The proportion of genes present in the paternal (rPAT) versus maternal (rMAT) subgenomes is depicted for each of five allotetraploid species arranged vertically from the oldest (top) to youngest (bottom). Tobacco was excluded from this analysis because the massive rearrangement it has experienced makes subgenomic identification based on chromosomal position intractable. The left panel includes only the non-organelle-targeted genes, the middle panel includes only the mitochondria-targeted genes, and the right panel includes only the plastid-targeted genes. In the left panel, the red-dashed line represents equal content across the subgenomes. In the right two panels, the rPAT and rMAT are normalized by the overall genome-wide gene number changes, excluding those genes targeted to organelles. Proportion deltas that depart significantly from the red line are filled in solid according to the direction of subgenomic bias (i.e., green: rPAT > rMAT; purple: rPAT < rMAT; no fill: rPAT ≈ rMAT). The intimacy of interactions is depicted on the y-axis for each of the right two panels from low or no interaction with organelle gene products (top), to interacting genes (middle), to genes involved in mitochondrial or plastid enzyme complexes (bottom).

