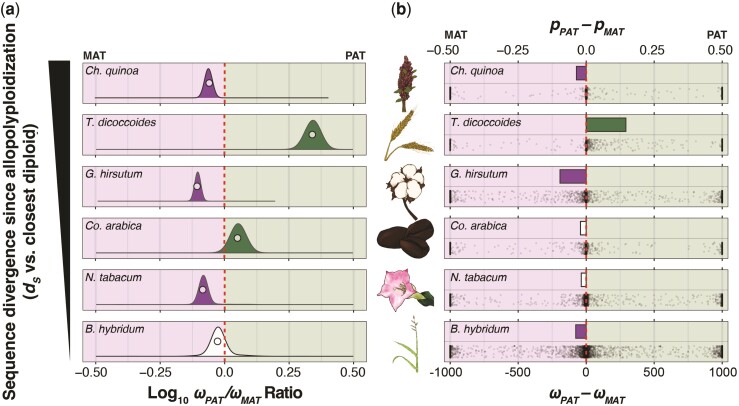
Fig. 4.
Genome-wide bias in ω (dN/dS) across the maternal and paternal subgenomes. (a) Log-transformed ratios of ω values in the paternal (ωPAT) versus maternal (ωMAT) subgenomes from concatenations (circles), and the underlying bootstrap distributions (density curves) of genes encoding proteins that are not targeted to either the plastids or mitochondria. Species panels are arranged vertically from the oldest (top) to the youngest (bottom). The red-dashed line indicates equal ω values across the subgenomes, the left side of each plot indicates higher ω values in the maternal subgenomes, and the right side of each plot indicates higher ω values in the paternal subgenome. The bootstrap distributions of ω ratios that depart significantly (P < 0.05) from the red line are filled in solid according to the direction of subgenomic bias (i.e., green: ωPAT/ωMAT > 1.0; purple: ωPAT/ωMAT < 1.0; no fill: ωPAT/ωMAT ≈ 1.0). (b) Estimates of ωPAT − ωMAT for each individual gene is depicted on the bottom half of each species’ panel and the proportion of genes with higher ω values in the paternal subgenome (pPAT) minus the proportion of genes with higher ω values in the maternal subgenome (pMAT) is depicted on the top half of each species’ panel for all genes not targeted to either the mitochondria or the plastids. The red-dashed line represents equal proportions of genes with higher ω values across subgenomes, and bars are filled in when proportion deltas are significantly different from zero (i.e., green: pPAT > pMAT; purple: pPAT < pMAT; no fill: pPAT ≈ pMAT).

