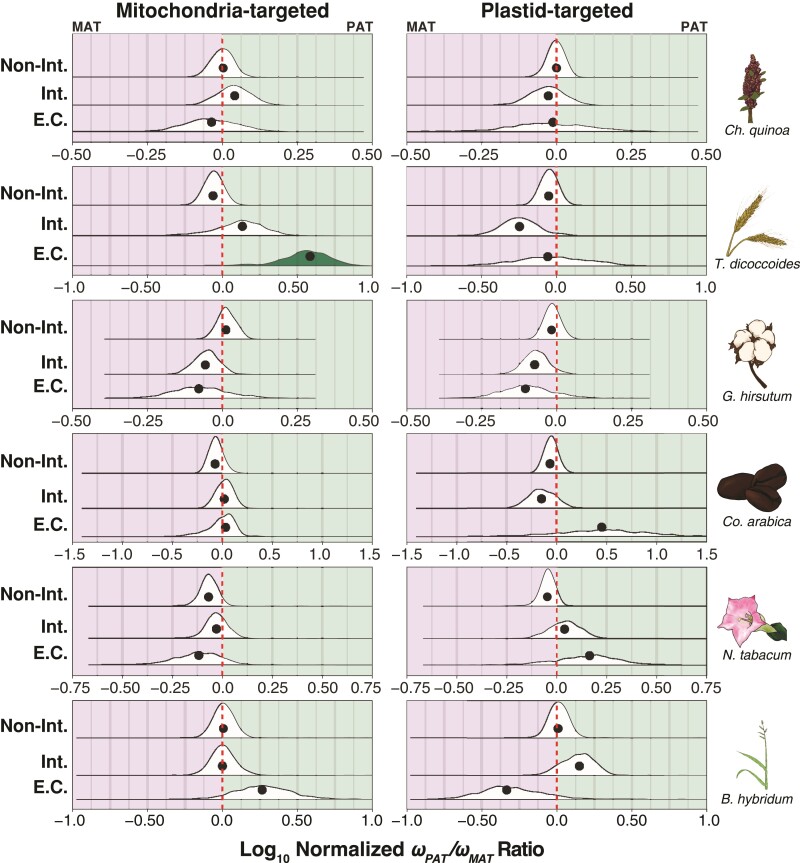
Fig. 5.
Ratios of maternal versus paternal subgenome ω values in the organelle-targeted genes. Log-transformed ratios of maternal versus paternal ω values from the terminal polyploid subgenome branches for concatenations (black circles) and underlying bootstrap distributions (density curves) of the mitochondria- (left) and plastid-targeted (right) genes in six focal allotetraploid species. Species panels are arranged vertically from the oldest (top) to the youngest (bottom). The red-dashed line indicates the ωPAT/ωMAT ratio for a concatenation of genes not targeted to the organelles (fig. 4a). Ratios left of the red line indicate higher ω values in the maternal subgenome, and ratios right of the red line indicate higher ω values in the paternal subgenome, after accounting for genome-wide patterns. Bootstrap distributions of ω ratios that depart significantly (P < 0.05) from the red line are filled in solid according to the direction of subgenomic bias (i.e., green: normalized ωPAT/ωMAT > 1.0; purple: normalized ωPAT/ωMAT < 1.0; no fill: normalized ωPAT/ωMAT ≈ 1.0). The intimacy of interactions is indicated on the y-axis from low or no interaction with organelle gene products (top), to interacting genes (middle), to genes involved in mitochondrial or plastid enzyme complexes (bottom).

