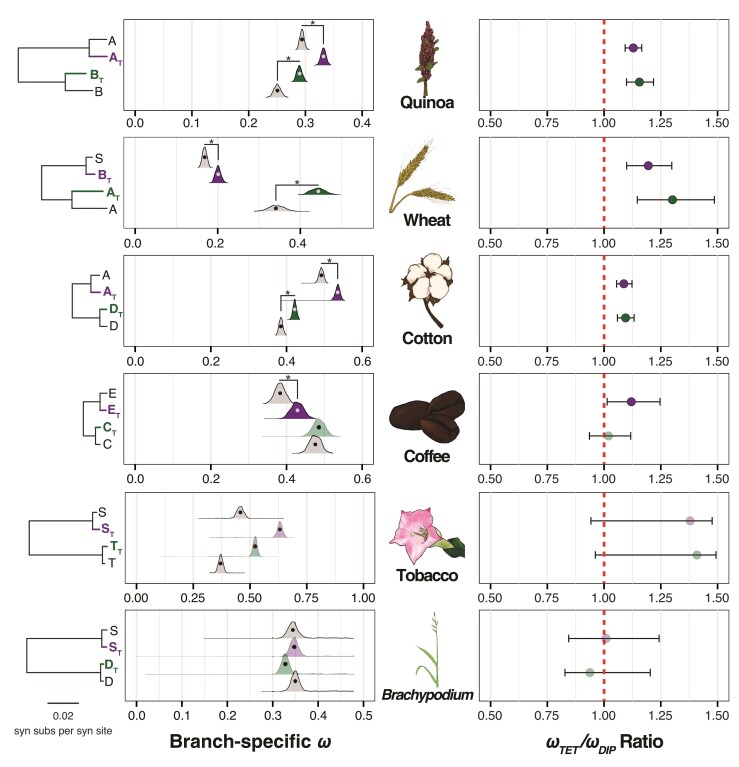
Fig. 6.
Comparison of branch-specific ω values in the polyploid subgenomes compared with their respective diploid models. Left: Maximum likelihood estimates (circles) and block-bootstrap distributions (density curves) of branch-specific ω values in the maternal (purple) and paternal (green) polyploid subgenomes compared with their diploid relatives (gray), with species arranged from the bottom to the top by increasing time since polyploidization. Trees to the left of the plots depict diploid polyploid relationships, with branch lengths representing synonymous substitution rates (i.e., dS), as shown in the left side of fig. 2. Statistical comparisons were made by calculating ω ratios for each bootstrap replicate and testing for overlap of 95% CIs with 1.0. Cases in which polyploid subgenomes significantly differ from their diploid relative are denoted by an asterisk and by a dark fill of the polyploid density curve. Right: Maximum likelihood estimates (circles) and 95% CIs inferred by the block-bootstrapping (error bars) of branch-specific ω ratios between the polyploid subgenomes and diploid relatives. The dashed red line represents equal ω values across comparisons.

