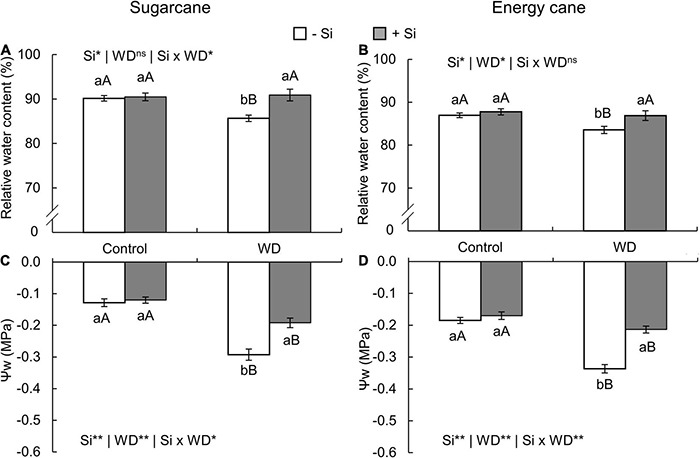
FIGURE 7.

Relative water content and leaf water potential (Ψw) in the sugarcane (A,C) and energy cane plants (B,D) in -Si and + Si under adequate water regime (control) and in WD for a period of 7 to 60 days after transplantation. ** and * significant with 1 and 5% probability, respectively, and ns, not significant by the F-test. Lowercase letters indicate differences in relation to Si and capital letters in relation to water deficit. n = 6. Si × WD: interaction.
