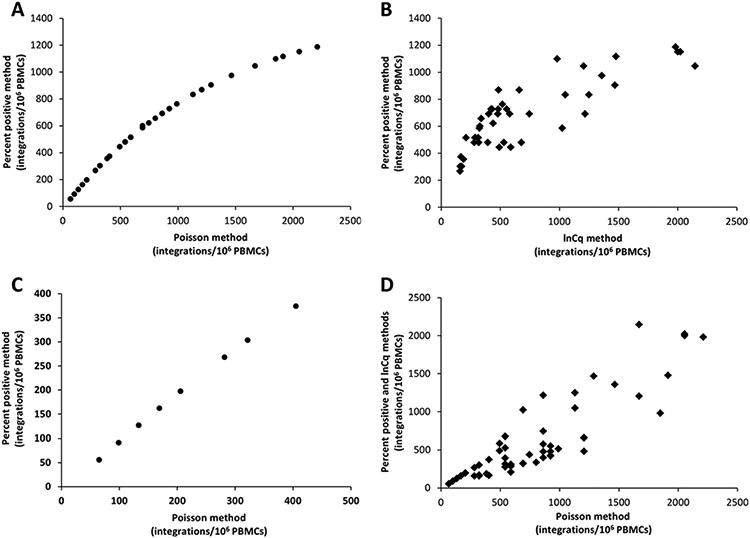
Fig. 3. Assessment of patient samples by use of the 3 different quantification methods.

(A), Comparison of the Poisson method with the percent positive method across all patient samples, revealing the logarithmic relation between the 2 methods. (B), Comparison of the percent positive method with the lnCq method in patients with >30% positive replicate reactions. (C), Comparison of the Poisson method with the percent positive method in patients limited to 400 copies (<26% positive reactions) reveals a linear relationship between the 2 methods. (D), Comparison of the Poisson method with both the percent positive method (samples <30% positive replicates) and the lnCq method (samples >30% and >80% positive replicates). The values of the y- and x-axes differ by 10-fold, as normalization for the calibrator was not performed on these data.
