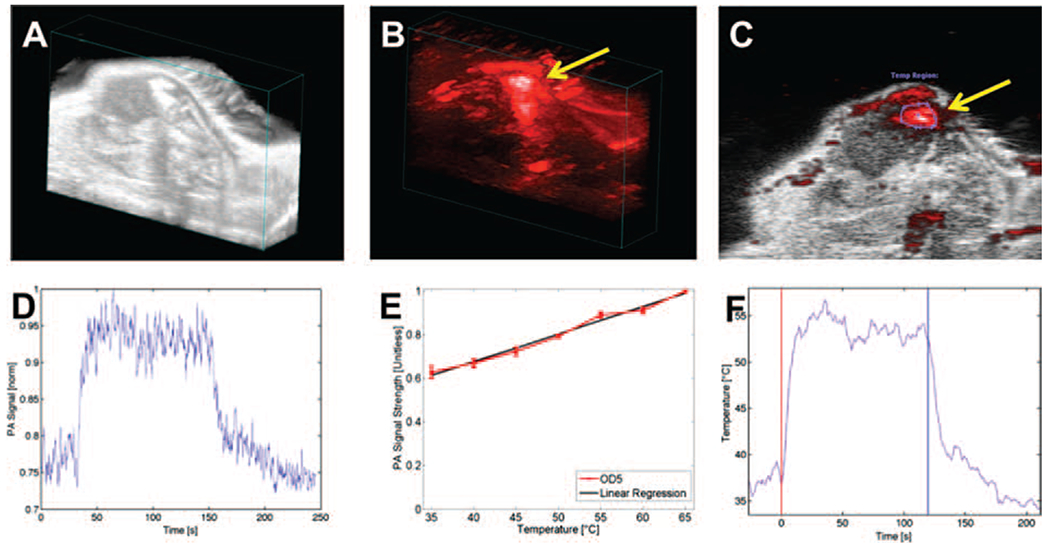
Figure 4.

In vivo photoacoustic (PA) imaging of mouse tumors following intratumoral injection of SPIO@AuNS and irradiation with an NIR laser. (A) Ultrasonogram of a tumor xenograft obtained in B mode (B) PA image of a tumor injected with SPIO@AuNS (C) overlaid PA and B-mode ultrasound images. (D) PA signal amplitude over time. A baseline PA signal was recorded for 40 s, and then laser treatment was delivered for 3 min. (E) The PA signal increased linearly with temperature, as determined with a phantom in a heated water bath. OD5: optical density 5. (F) Conversion of PA signal to temperature using the equation derived from the line in panel E. The red vertical line indicates the start of laser treatment, and the blue vertical line indicates the end of laser treatment.
