Fig. 4.
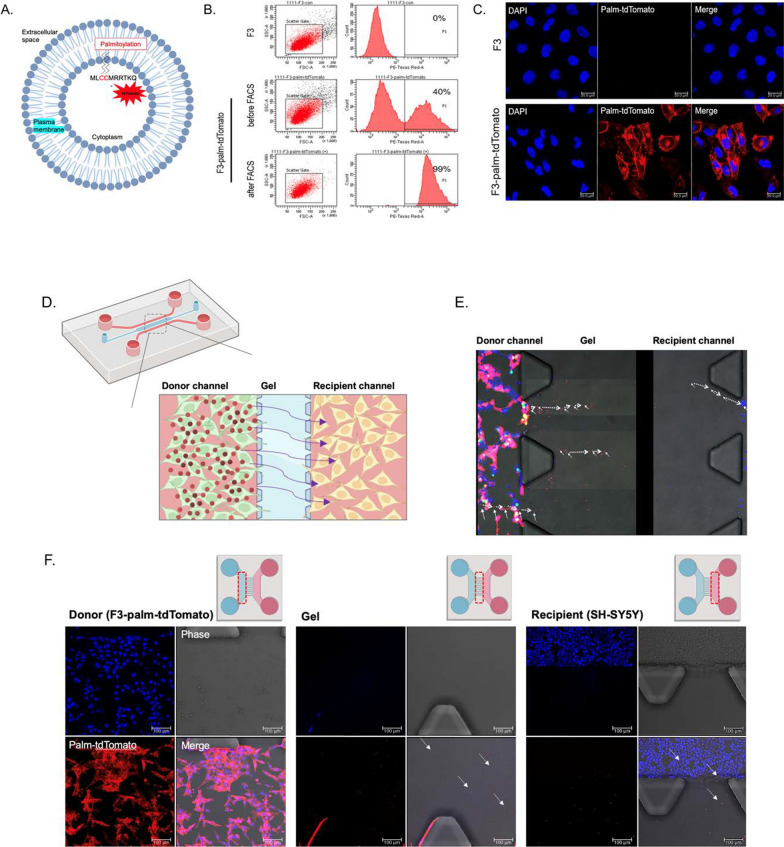
In vitro tracing of EVs secreted from palm-tdTomato virus-transduced F3 cell line in microfluidic device. A Schematic diagram of palm-tdTomato lentiviral vector for EV labeling. B TdTomato fluorescence positive F3 cells were sorted by flow cytometry after infection of palm-tdTomato lentivirus. The number of fluorescence positive cells were increased from 40 to 99%. C Confocal fluorescence images in cell-sorted tdTomato fluorescence positive F3 cells. Scale bar = 20 µm. D Schematic diagram of the two-channel microfluidic device. E F3-palm-tdTomato cells in donor channel and SH-SY5Y cells in recipient channel were co-cultured on a microfluidic device. Time-lapse imaging was used to track the migration of tdTomato fluorescence positive EVs in interchannel area (arrows) using time-lapse imaging. The imaging was performed for 6 times with 5 min intervals. F Each channel was monitored, showing tdTomato positive EVs (arrows) budding out from donor channel and migrating to the recipient channel using confocal microscopy. Scale bar = 100 µm

