Figure 3.

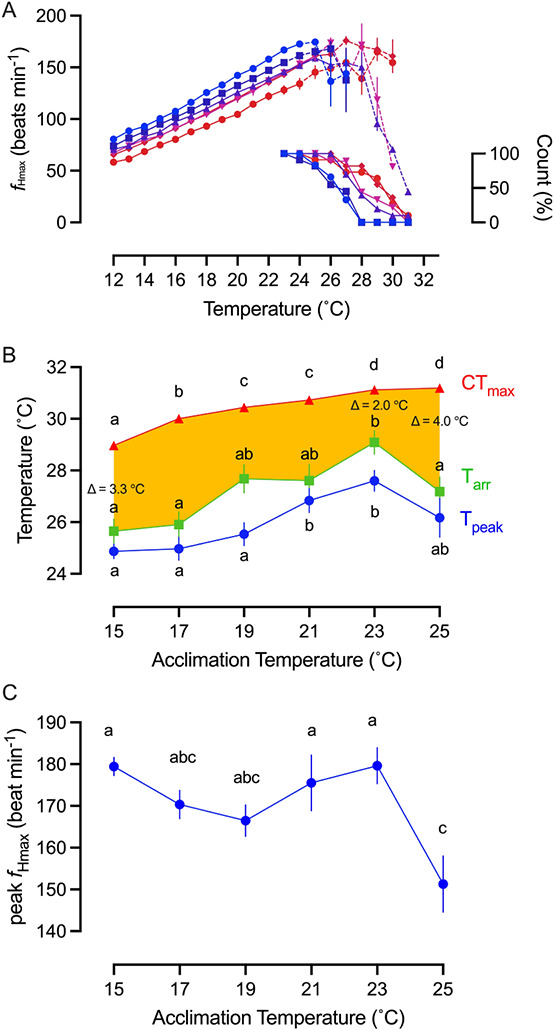
Maximum heart rate (fHmax) and critical thermal maximum (CTmax) in response to acute warming of PFRC H-strain rainbow trout (O. mykiss) as a function of acclimation temperature. (A) Mean fHmax for each acclimation temperature group during acute warming (n = 12). Acclimation temperatures were 15°C ( ), 17°C (
 ), 19°C (
 ), 21°C (
 ), 23°C (
 ) and 25°C (
 ). Data points are connected by a solid line provided all fish in an acclimation group retained a rhythmic heartbeat at that temperature. If not a broken line connects the average fHmax for the fish the still retained a rhythmic heartbeat, with the percentage count remaining indicated in the inset. All individual fish had developed an arrhythmic heartbeat by 31°C and by 28°C for those at the two coldest acclimation temperatures. (B) Temperature at which each acclimation group reached its CTmax (n = 10), cardiac arrhythmia temperature (Tarr) and maximum fHmax (Tpeak). Amber area labels the difference between whole-organism and tissue thermal tolerance and the differences between CTmax and Tarr at 15°C, 23°C and 25°C acclimation temperature are denoted. Two-way ANOVA performed indicates Tarr is significantly different from CTmax (F = 213.2, P < 0.0001). (C) Peak fHmax reached at each acclimation temperature (n = 12). All values are presented as means ± sem, except right y-axis in (A) presented as count in %. (sem may be hidden by the symbol). Dissimilar letters represent statistically significant differences among mean values for that variable.
