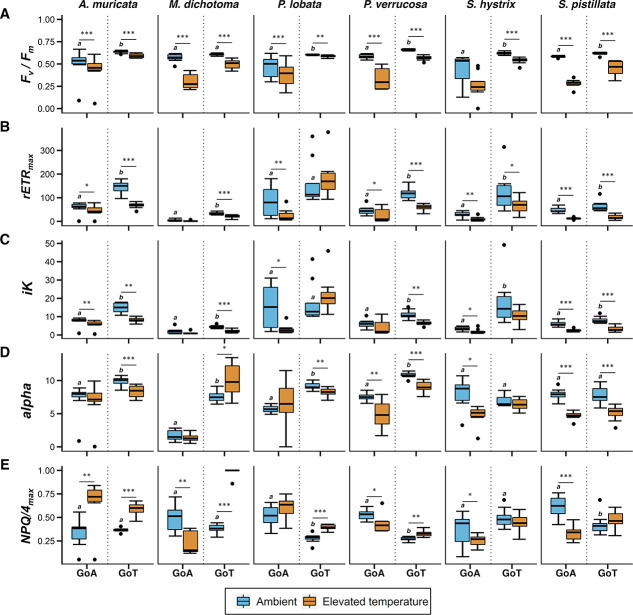
Figure 2.
Dark-adapted Fv/Fm, rETRmax, iK, alpha, NPQ/4max of six reef-building coral species from the GoA or GoT, under ambient (22°C and 28°C, respectively) and then after elevation of temperatures (34°C). Asterisks represent significance levels from paired t-test or Wilcoxon rank sum test per species and location, between thermal treatments. *P < 0.05, **P < 0.01, ***P < 0.001. Different letters above the box in the ambient treatment indicate significant differences between location per species under ambient temperature (n = 8, α = 0.05). Black dots correspond to plots outliers. Error bars represent standard deviation.

