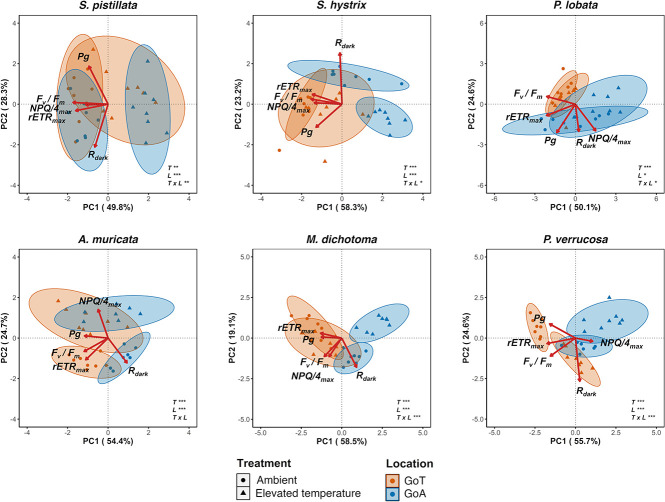
Figure 6.
PCA ordination biplots using biological markers [Fv/Fm, rETRmax, NPQ/4max, dark respiration (Rdark), gross photosynthesis (Pg)], temperature [ambient (22°C in the GoA and 28°C in the GoT) and elevated temperature (34°C)] and location (GoA or GoT) for each coral species. Ellipses represent statistical clusters of 95% similarities. Red arrows represent eigenvectors for each biological marker used in this analysis. Results of PERMANOVA analysis are reported for each biplot using temperature (T) and location (L) as fixed factors and computing their interaction (T × L) (n = 8, α = 0.05).

