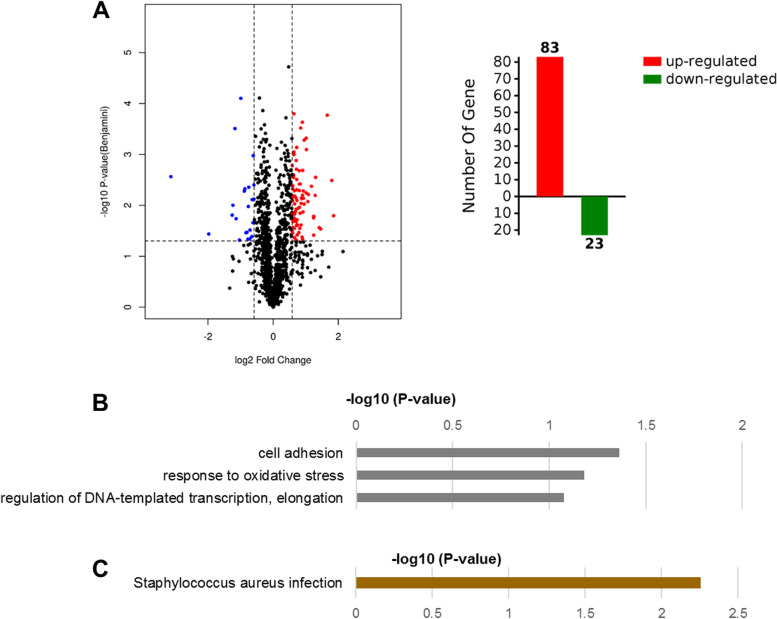
Fig. 4.
Differentially expressed proteins between the control groups and lomitapide-treated (at 1/2 × MIC) groups found by proteomics analysis. A Volcano map and total number of differentially expressed proteins, the horizontal axis represents the ratio of differentially expressed proteins in lomitapide treated group and untreated group of S. aureus, red shows an increase after treated and blue shows decrease. Vertical axis represents p-value between the two groups. B Gene Ontology analysis applied to differentially expressed proteins according to biological process. C KEGG analysis of the differentially expressed proteins using the DAVID database [22]

