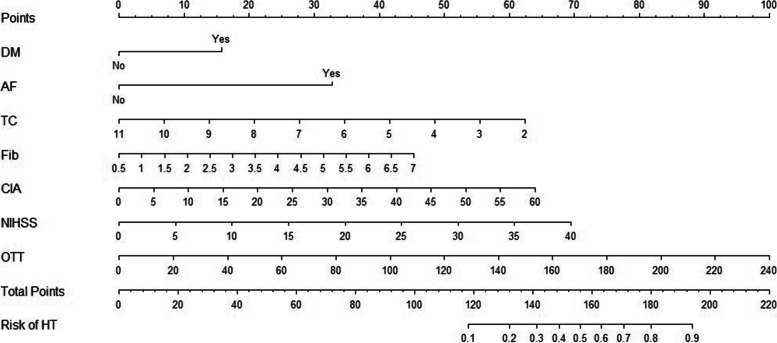
Fig. 1.
The nomogram prediction model. To use, mark an individual’s DM, draw a vertical line up to the points axis to establish the score associated with DM. Repeat this process for the other six predictors. Add the scores for each predictor together and mark the total score on the total points axis. A vertical line is drawn down to the risk of the HT axis to obtain the probability. DM = diabetes mellitus. AF = atrial fibrillation. TC = total cholesterol. Fib = fibrous protein. CIA = cerebral infarction area. NIHSS = National Institutes of Health Stroke Scale score. OTT = onset-to-treatment

