
Figure 4.
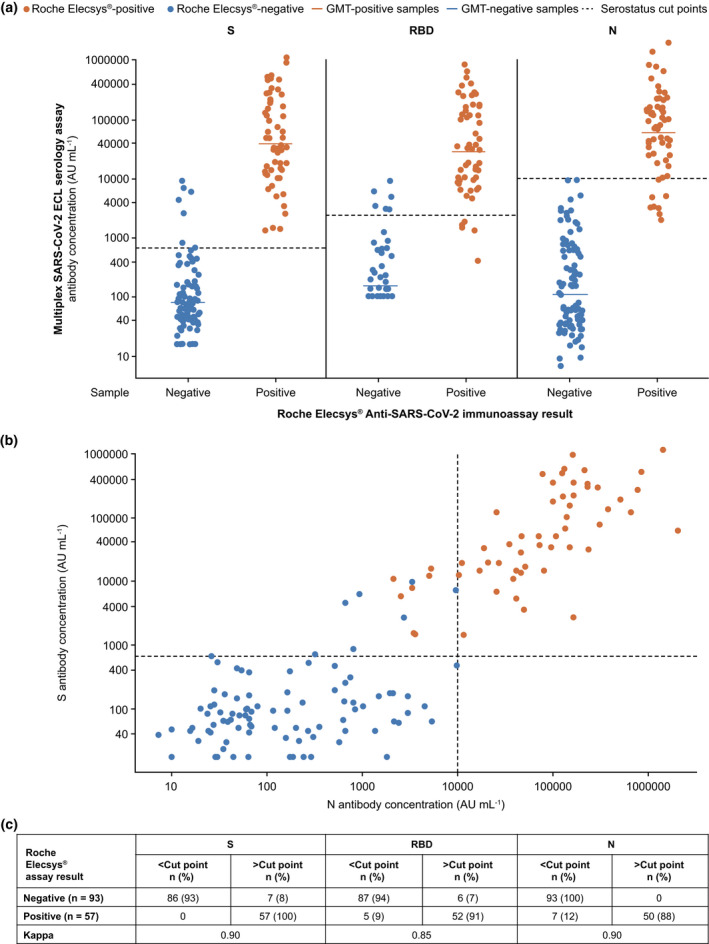
SARS‐CoV‐2 S, RBD and N antibody distribution by serostatus cut points (dashed lines) in samples from donors with known Roche Elecsys® Anti‐SARS‐CoV‐2 immunoassay results (a) and distribution of S versus N antibody concentrations as measured by the multiplex SARS‐CoV‐2 ECL serology assay (b). In a, GMT values for each group are shown as solid‐coloured lines. In b, RBD versus N distribution is the same as S versus N and is not shown. AU, arbitrary units; ECL, electrochemiluminescence; GMT, geometric mean titre; N, nucleocapsid protein; RBD, receptor‐binding domain; S, spike protein; SARS‐CoV‐2, severe acute respiratory syndrome coronavirus 2.