FIGURE 2.

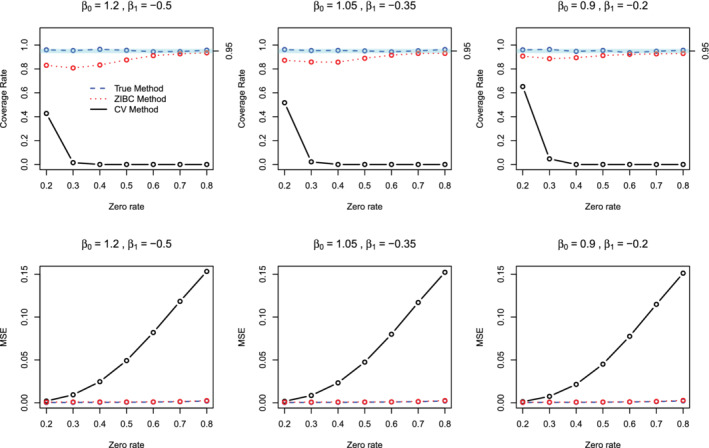
Coverage rates and MSE values of the true (blue dashed line), ZIBC (red dotted line) and conventional (black solid line) methods from 1000 replications () [Colour figure can be viewed at wileyonlinelibrary.com]

Coverage rates and MSE values of the true (blue dashed line), ZIBC (red dotted line) and conventional (black solid line) methods from 1000 replications () [Colour figure can be viewed at wileyonlinelibrary.com]