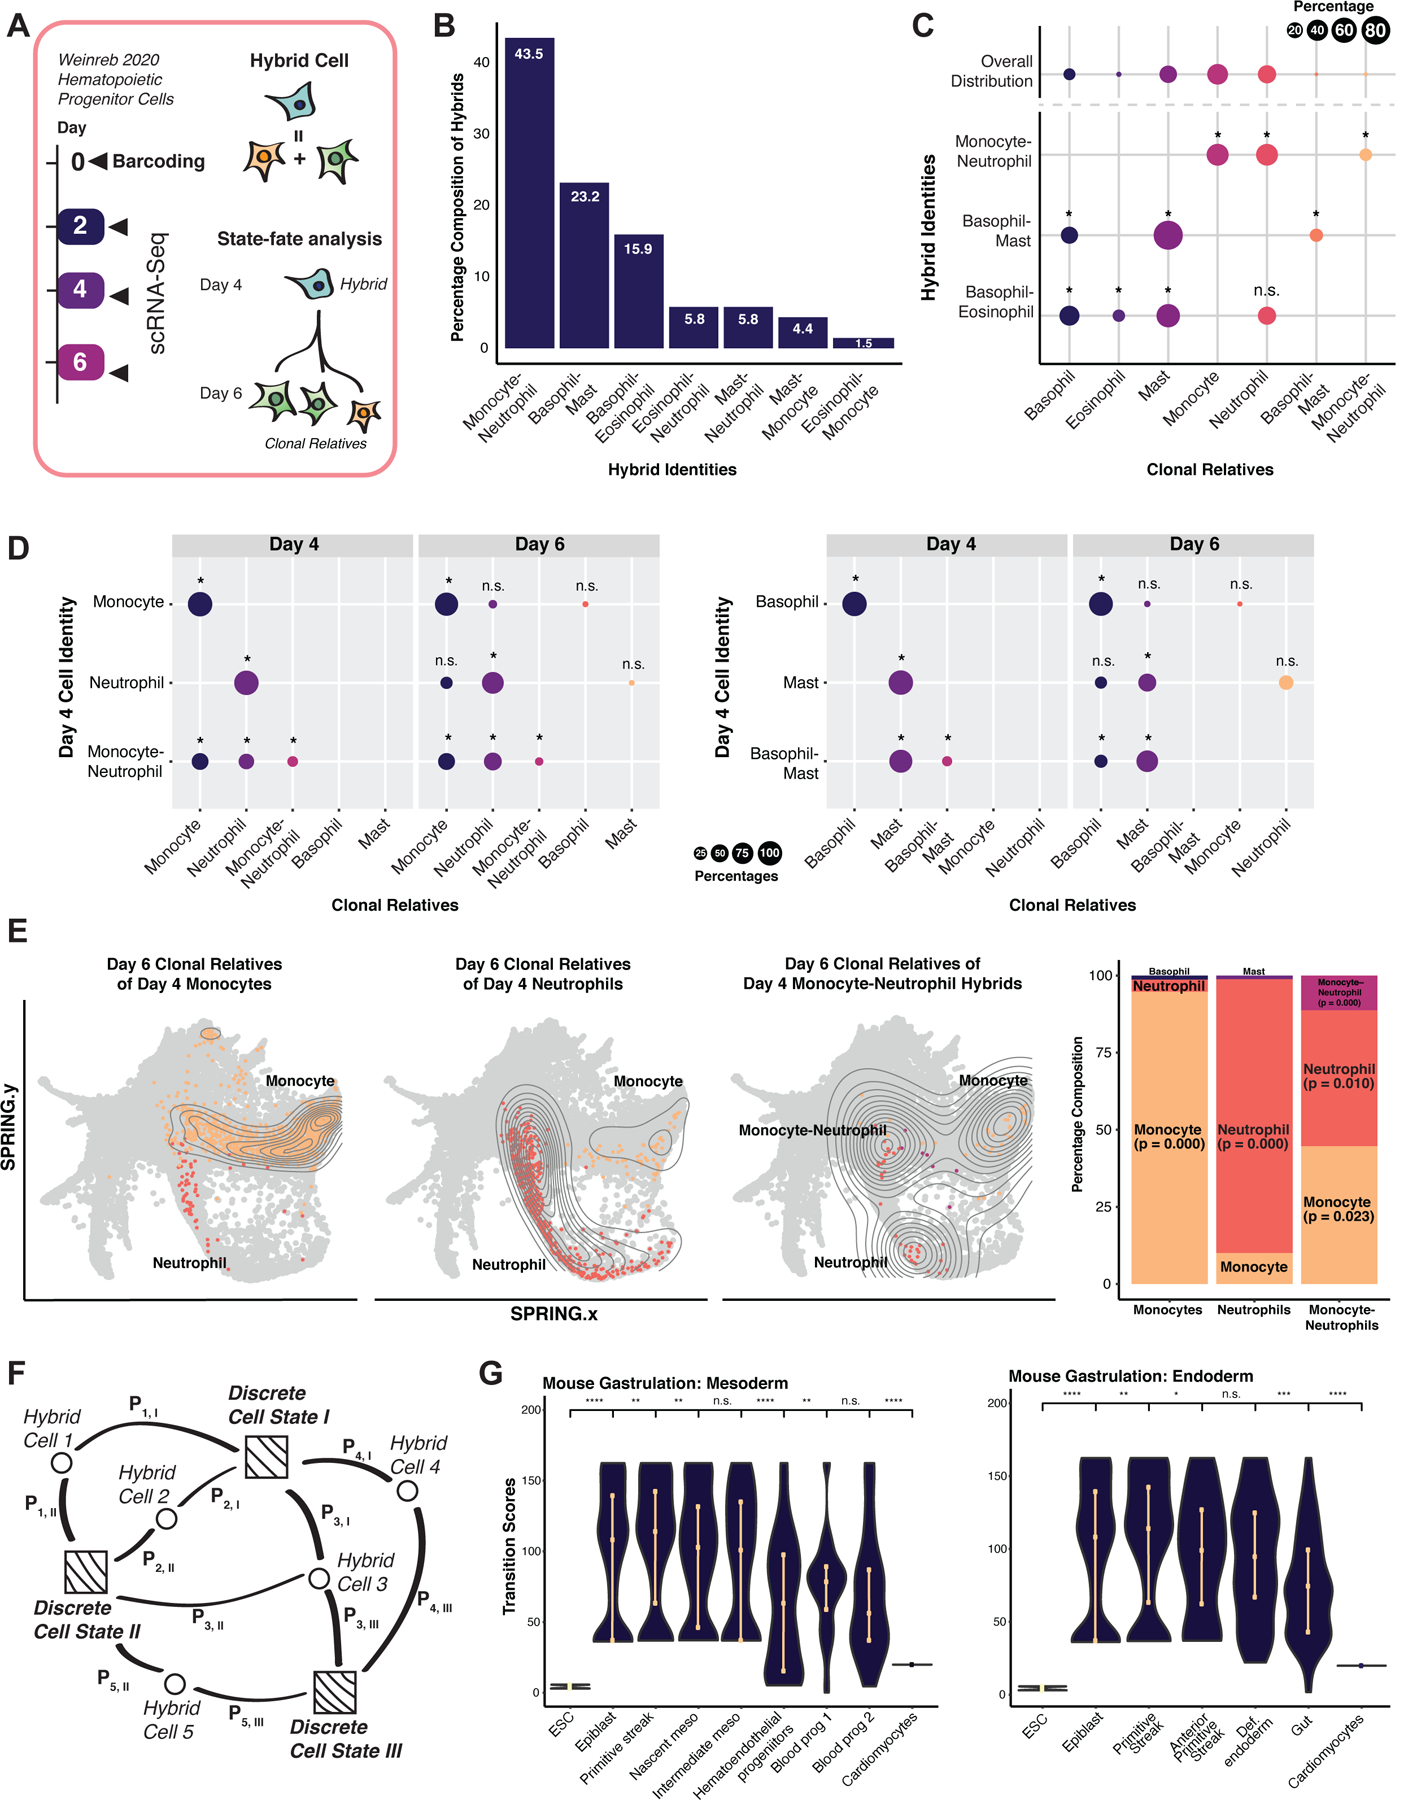
Figure 3. Evaluation of hybrid cells using ground-truth lineage tracing.

(A) Weinreb et al., 2020 hematopoietic lineage-tracing dataset. Hematopoietic progenitor cells were isolated, barcoded at day 0 and collected for scRNA-seq at day 2. Under myeloid differentiation conditions, cells were collected at days 4 and 6 for scRNA-seq. (B) Major hybrid populations identified by Capybara. (C) Cell-type composition of cells clonally related to major hybrid cell types. Upper row: Cell-type distribution of the overall population. Lower rows: Average cell-type breakdown for all clonal relatives of each major hybrid cell population (*: P <= 0.05, n.s.: P > 0.05, randomization test; 24 +/− 4 cells per clone, 10 clones, 243 cells). (D) State-fate analysis: We identified clones composed of discrete or hybrid identities at day 4 and assessed the cell-type composition of their differentiated clonal relatives at day 6. Top rows: day 6 clonal relatives derived from day 4 lineage-restricted clones. Bottom row: day 6 clonal relatives derived from day 4 clones containing hybrid cells (*: P <= 0.05; randomization test). (E) SPRING projection of cells related to monocyte- and neutrophil-restricted clones and hybrid clones. (F) Capybara’s transition metric. Squares: discrete cells. Circles: hybrid cells. Pi,j: probability of cell i transitioning to cell j. We calculate the transition score of each cell type as the accumulated information received from each cell connection. (G) Transition scores of mouse gastrulation, embryonic stem cells (ESCs), and cardiomyocytes (****: P <= 0.0001, ***: P <= 0.001, **: P <= 0.01, *: P <= 0.05, Wilcoxon test). See also Figure S3.
