
Figure 2.
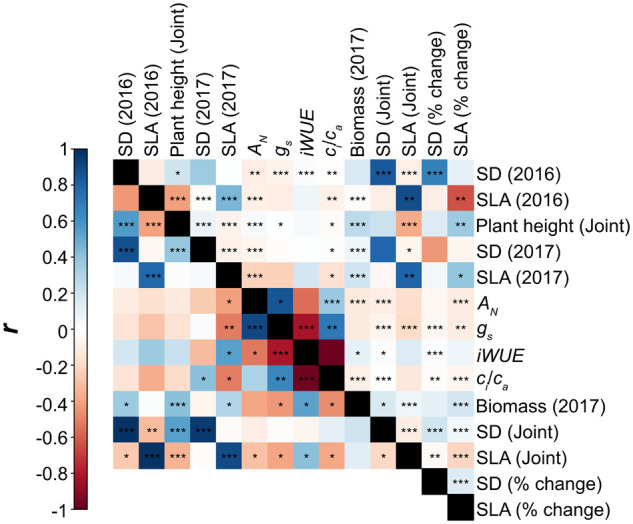
Correlogram demonstrating phenotypic (Pearson correlation; above diagonal) and genetic (Bivariate model; below diagonal) correlations for all measured parameters. Where appropriate, the associated model from which predicted means were extracted is indicated in parenthesis. The color of each square describes the correlation coefficient of each pairwise interaction. Significant correlations are denoted at the level of 0.001 (***), 0.01 (**), and 0.05 (*). Genetic and phenotypic correlations between traits extracted from each environment model are listed in Supplemental Table S2.