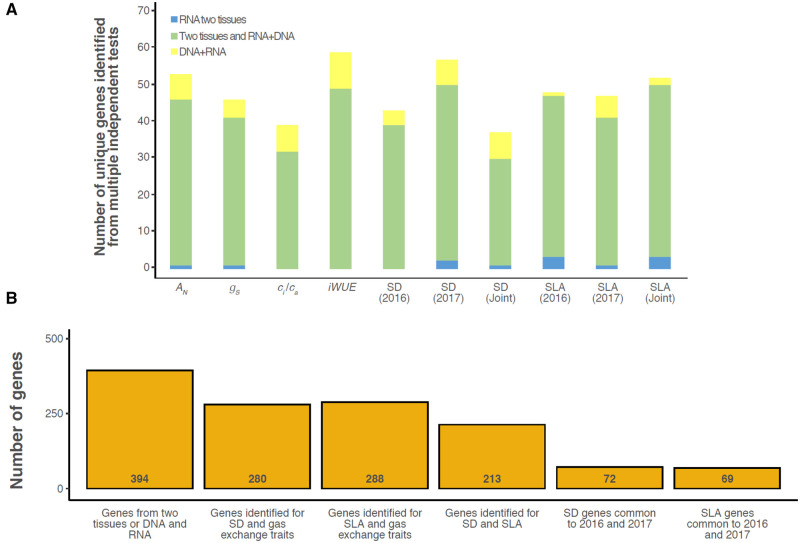
Figure 6.
The number of common and unique genes identified via independent tests. A, Barplot of the number of unique genes identified with higher confidence as potentially underlying variation on a trait-by-trait basis for net photosynthesis (AN), gs, ci/ca, iWUE, SD, and SLA. Higher confidence genes were defined as those identified from multiple tests representing independent evidence from either: TWAS only, but in both tissues (blue fill); Fisher’s combined test and/or TWAS in both tissues (green fill); or GWAS plus TWAS or Fisher’s combined test in one tissue (yellow fill). B, Barplot of the number of unique genes consistently identified in multiple independent tests across different traits or growing seasons. For reference, the total number of unique genes identified by a parallel trait by trait approach (394, see A) is presented in the first bar. See Supplemental Tables S8–S10 for gene lists related to each test, tissue, year, and trait.

