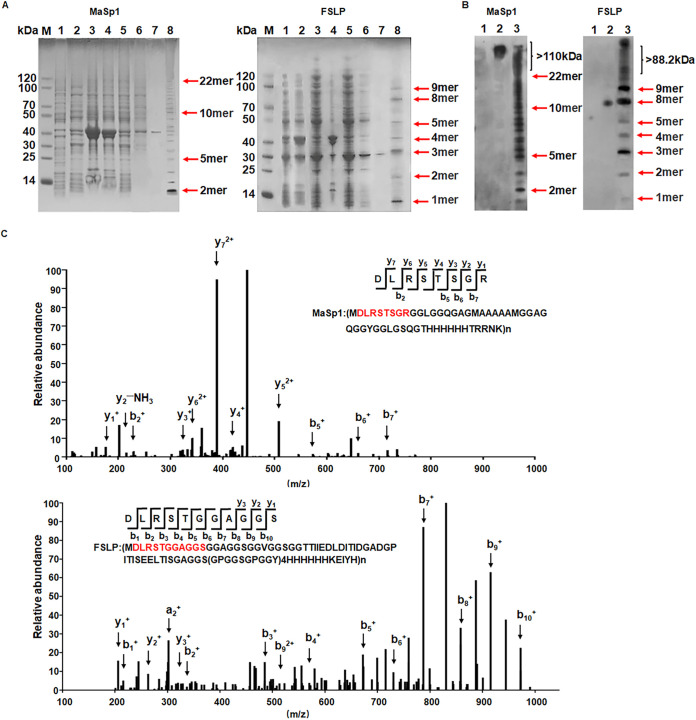
FIG 3.
Identification of MaSp1 and FSLP. (A) Coomassie brilliant blue staining of purified spider silk protein. (Left) SDS-PAGE gel of MaSp1. (Right) SDS-PAGE gel of FSLP. M, marker; lane 1, uninduced cell lysate; lanes 2 to 7, induced cell sample; lane 2, whole-cell lysate; lane 3, precipitate; lane 4, supernatant; lane 5, sample washed with lysis buffer; lane 6, sample washed with lysis buffer with 10 mM imidazole; lane 7, sample washed with lysis buffer with 50 mm imidazole; lane 8, freeze-dried sample. (B) Western blot of purified spider silk protein. (Left) Western image of MaSp1 protein. (Right) Western blot of FSLP protein. Lane 1, uninduced cell lysate; lane 2, positive control; lane 3, freeze-dried sample. (C) Mass spectrum of purified spider silk protein. (Upper) Mass spectrogram of MaSp1 polypeptide. y1, R; y2, RG; y3, RGS; y4, RGST; y5, RGSTS; y6, RGSTSR; y7, RGSTSRL; b2, DL; b5, DLRST; b6, DLRSTS; b7, DLRSTSG. (Lower) Mass spectrogram of FSLP polypeptide. y1, S; y2, SG; y3, SGG; b1, D; b2, DL; b3, DLR; b4, DLRS; b5, DLRST; b6, DLRSTG; b7, DLRSTGG; b8, DLRSTGGA; b9, DLRSTGGAG; b10, DLRSTGGAGS. The characteristic peptide sequence of spider silk protein is highlighted in red. The peaks representing digested signature oligopeptides are indicated with arrows. y and b variables represent the digestion products from the C and N terminus, respectively.

