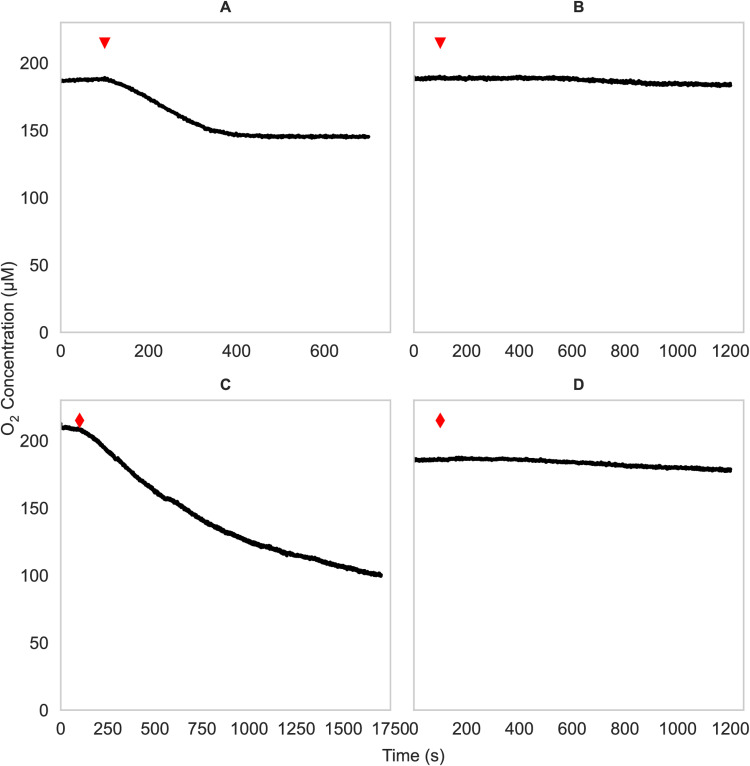
FIG 4.
Oxygen uptake measurements in cell suspensions of “Ca. Nitrosocosmicus franklandus.” Concentrations of 200 μM NH2OH (A and B, red triangles) or 600 μM N2H4 (C and D, red diamonds) were added. Control cells (A and C) are compared to cells incubated with 100 μM phenylhydrazine (B and D). Experiments were performed at least three times with similar results.

