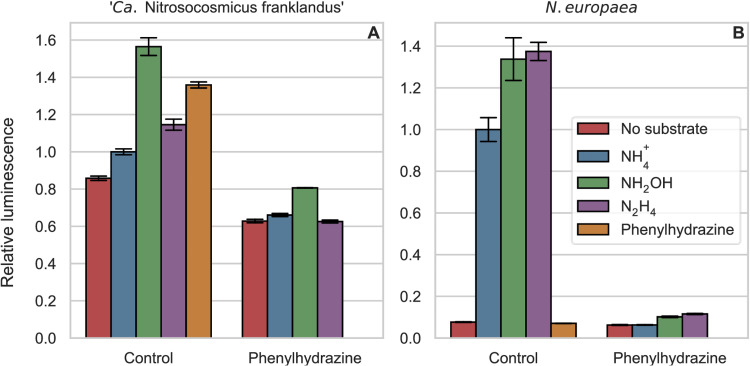
FIG 5.
Relative ATP-dependent luminescence, with NH4+ controls normalized to a value of 1. All treatments were added in 100 μM concentrations, and the cells were incubated for 10 min before ATP was measured. Bars on the left and right of each panel show cells preincubated without and with phenylhydrazine, respectively. Error bars represent the standard deviations (n = 3).

