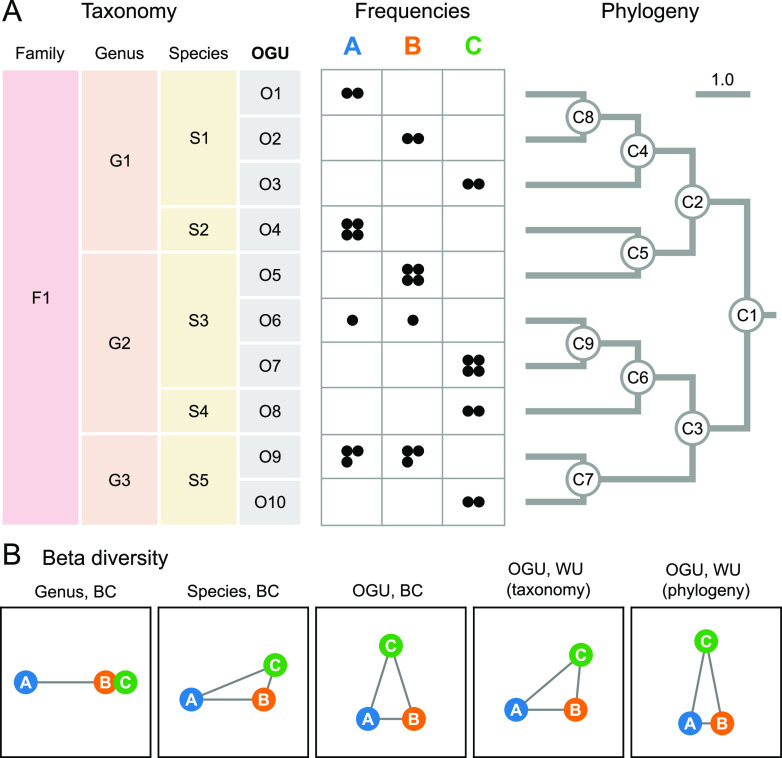
FIG 1.
Feature resolution impacts community ecology analysis in small conceptual examples. (A) Synthetic data set involving three microbial communities, each having 12 unique read hits, as represented by black circles in the frequency table, to a total of 10 reference genomes (OGUs), classified under five species, three genera, and one family, as noted on the left. A phylogenetic tree of the 10 genomes is shown on the right. In this simplified case, the phylogeny is not much more complex than the taxonomy (with three more edges); however, the taxonomic assignment and the phylogenetic placement of genome O5 are not consistent. (B) Beta diversity of the data set. The three samples (circles) are connected by edges representing the pairwise distances calculated by Bray-Curtis (BC) or weighted UniFrac (WU) on the frequency table. For the latter measure, either the taxonomy or the phylogeny was used to quantify the hierarchical relationships among OGUs, as noted in the parentheses. The edge lengths were normalized so that their sum is equal in each graph. This synthetic case study demonstrates that different resolutions of features and feature structures can lead to very different conclusions regarding sample relationships.

