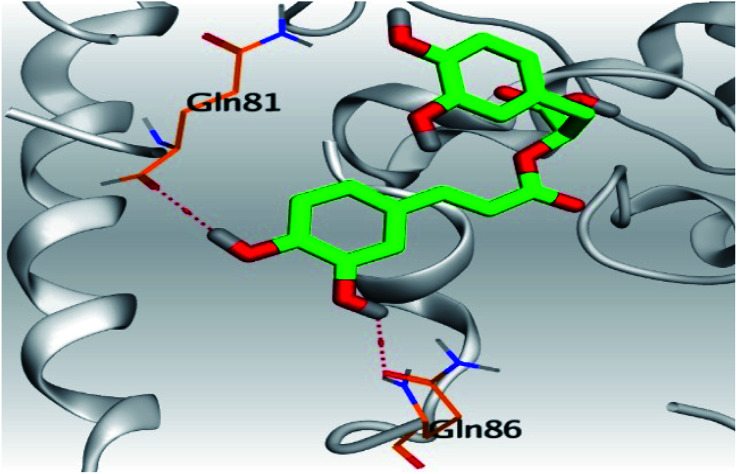
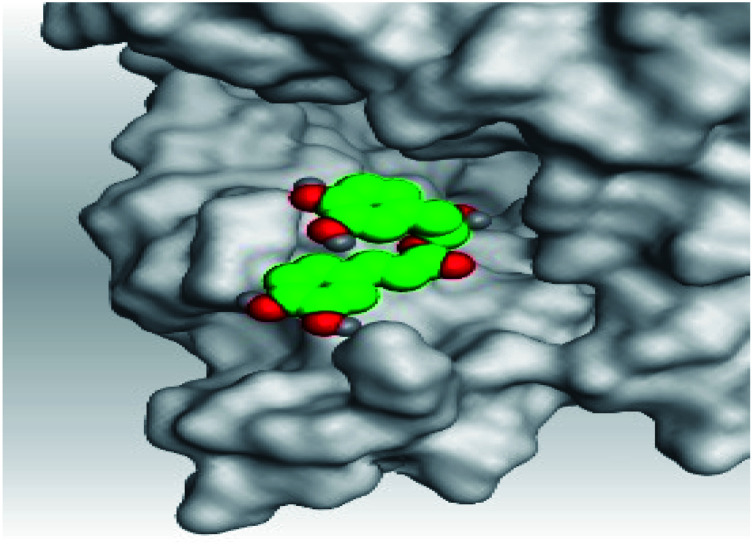
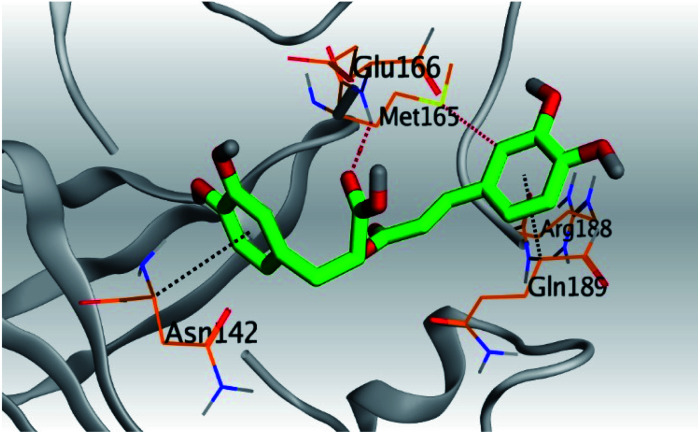
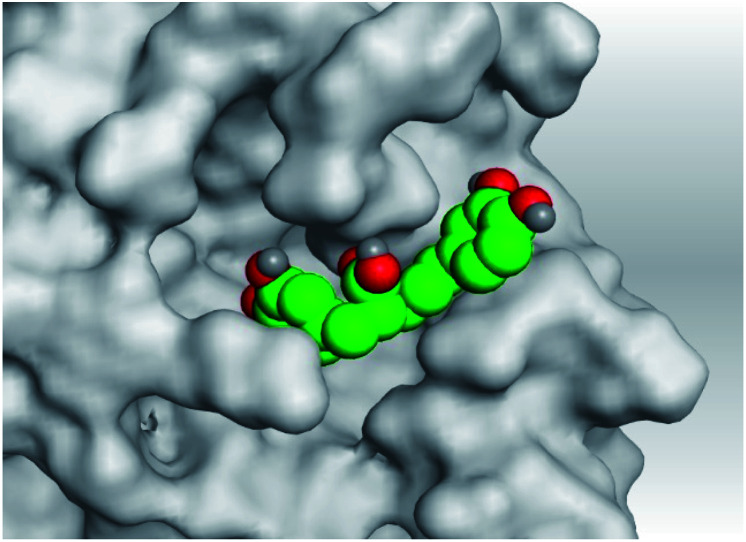
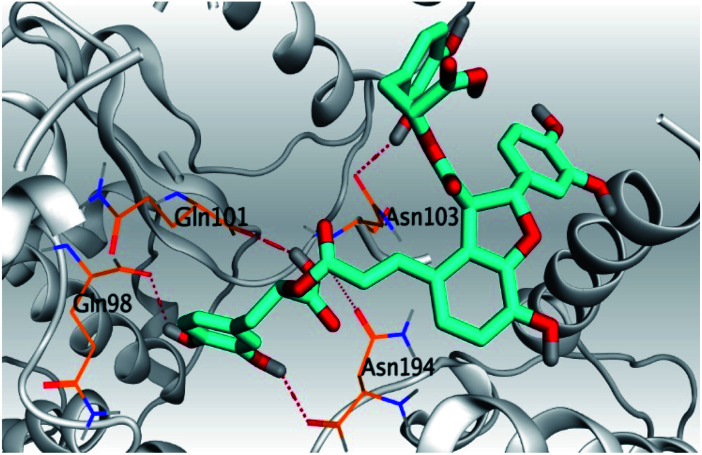
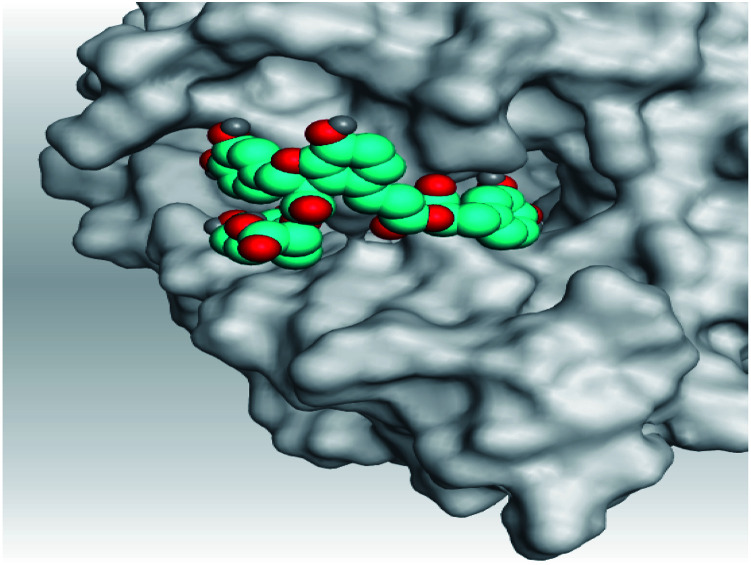
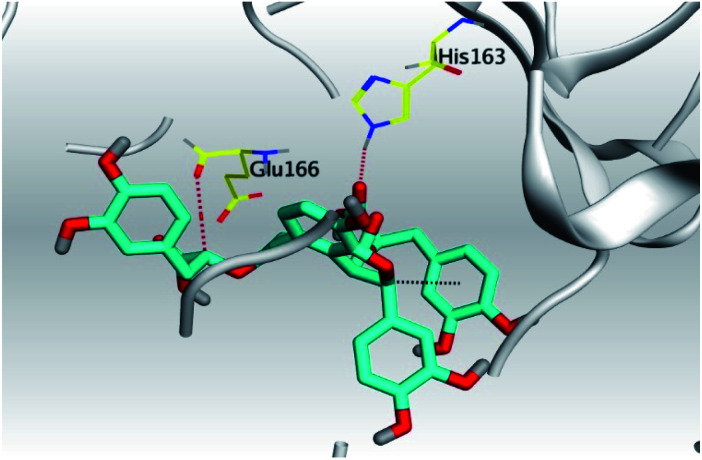
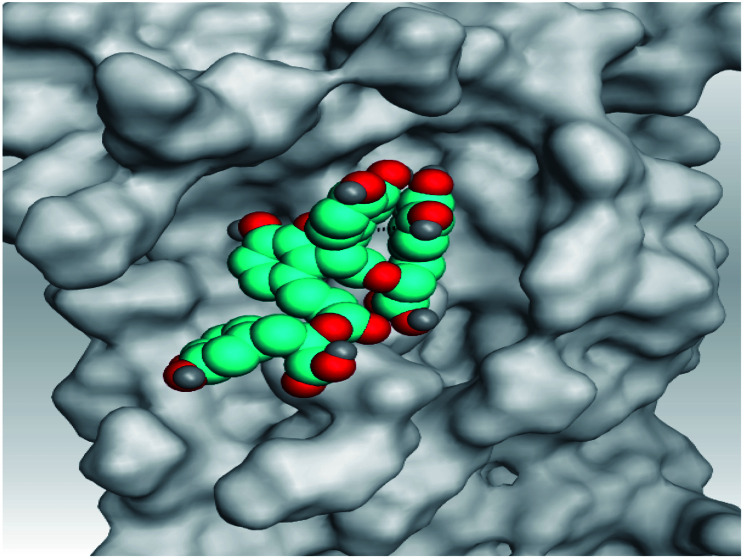
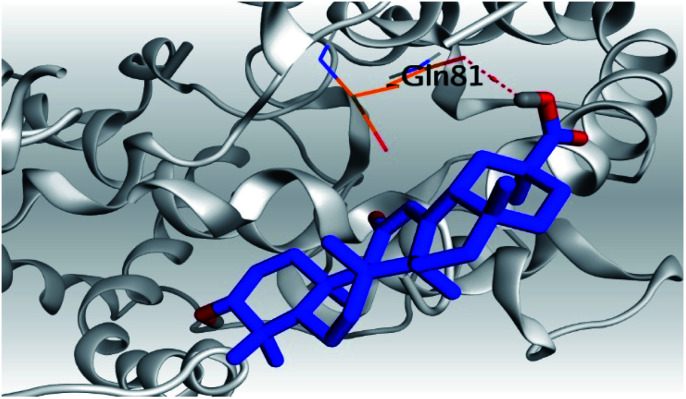
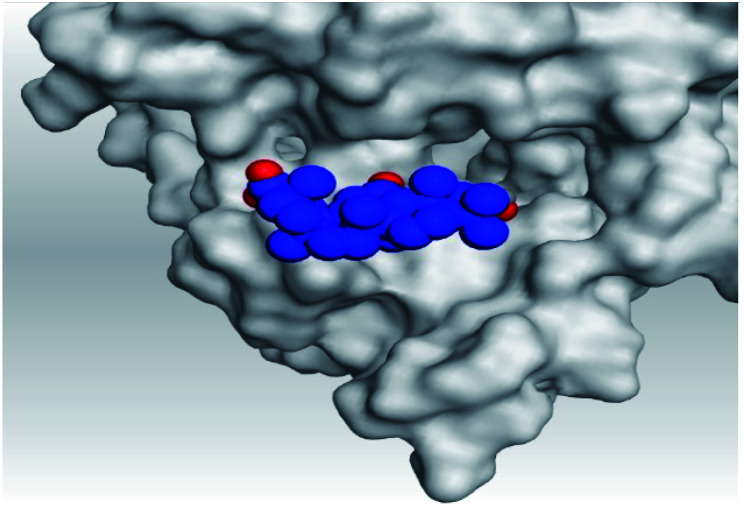
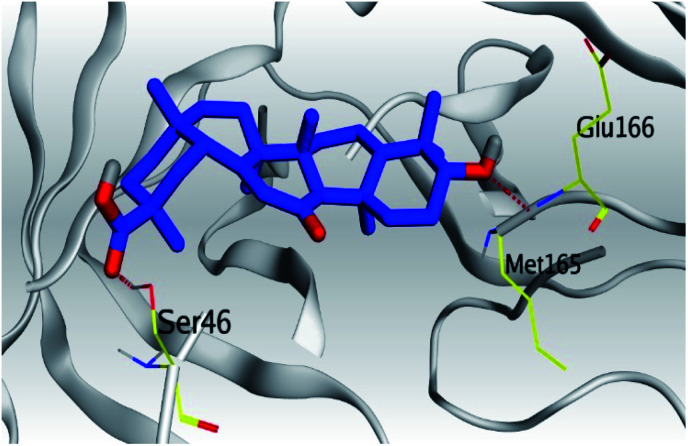
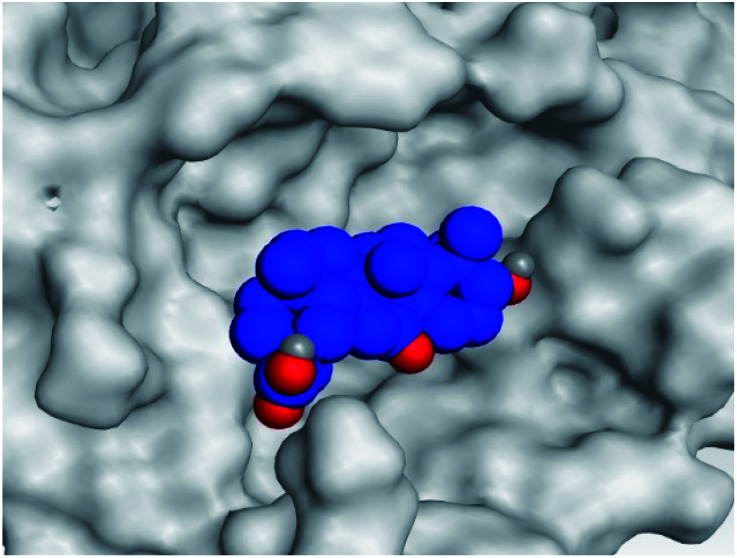
3D pictures representing the binding interactions and positioning of the tested natural compounds (1–6) inside both S and Mpro pockets of the SARS-CoV-2, besides the N3 inhibitor of Mpro (redocked, 7)a.
| Comp. | 3D interactions | 3D protein positioning | |
|---|---|---|---|
| 1 | S |
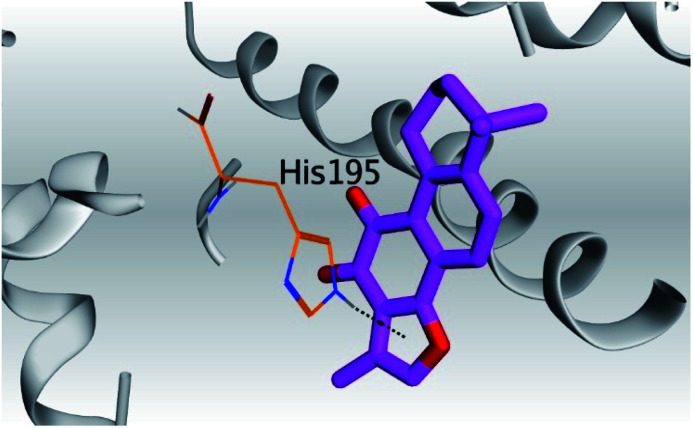
|
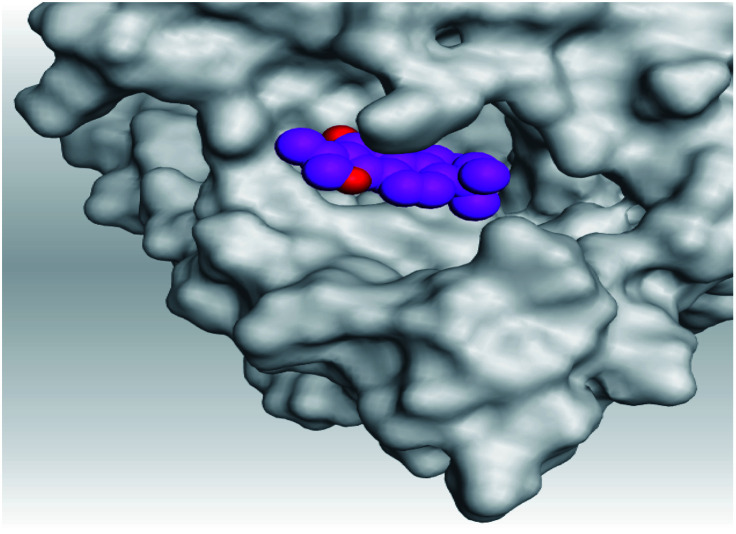
|
| Mpro |
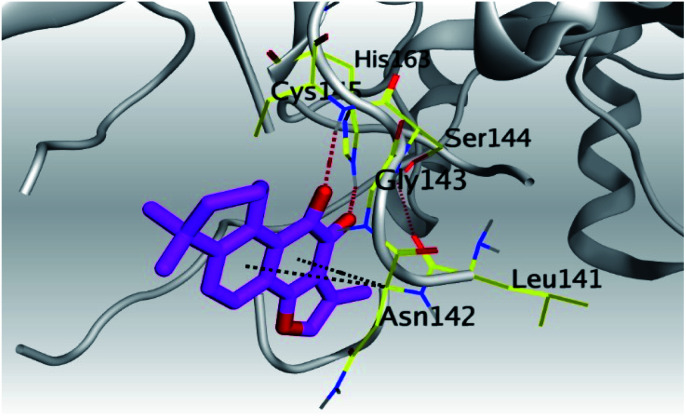
|
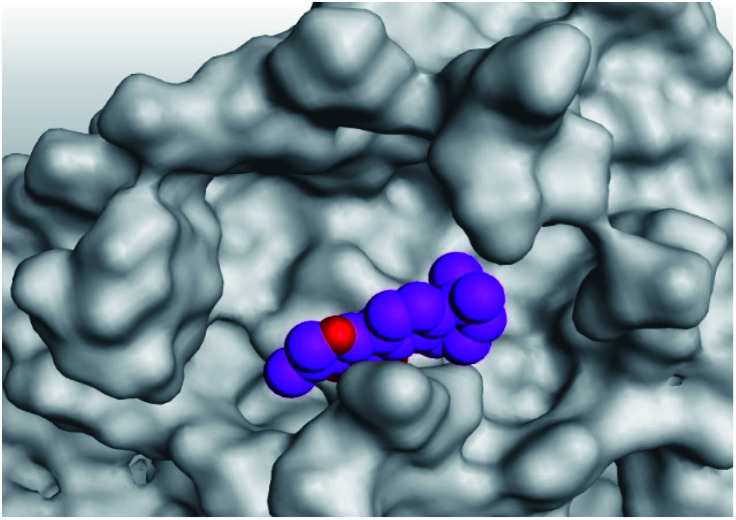
|
|
| 2 | S |
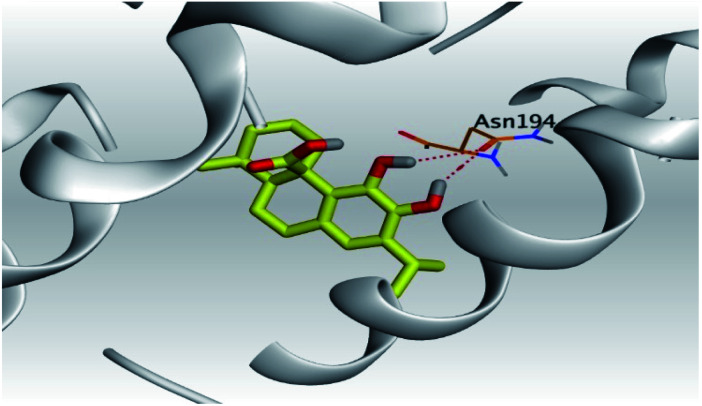
|
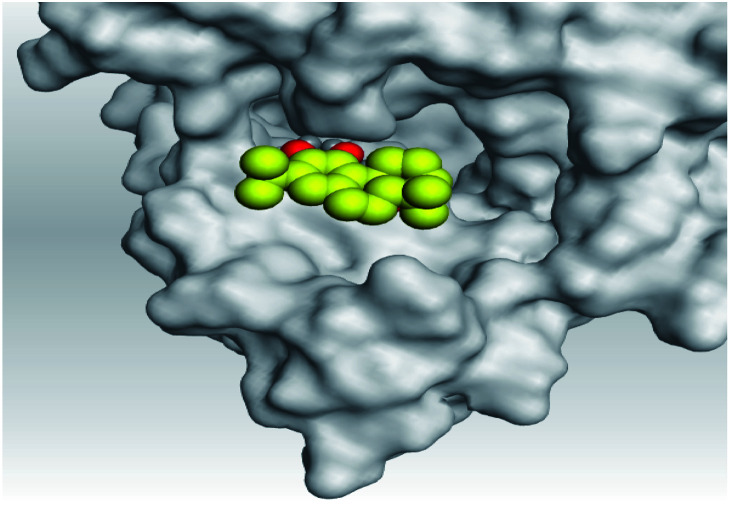
|
| Mpro |
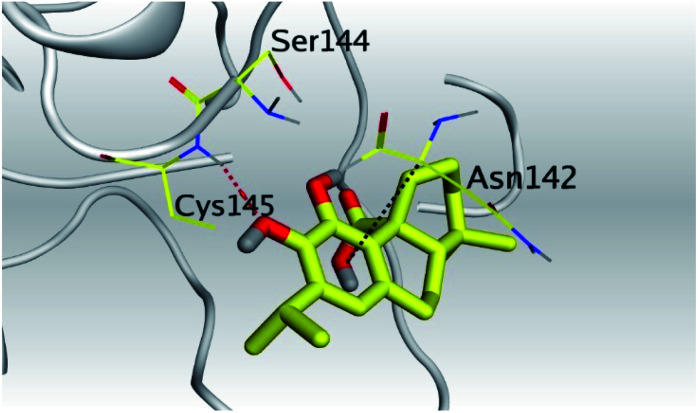
|
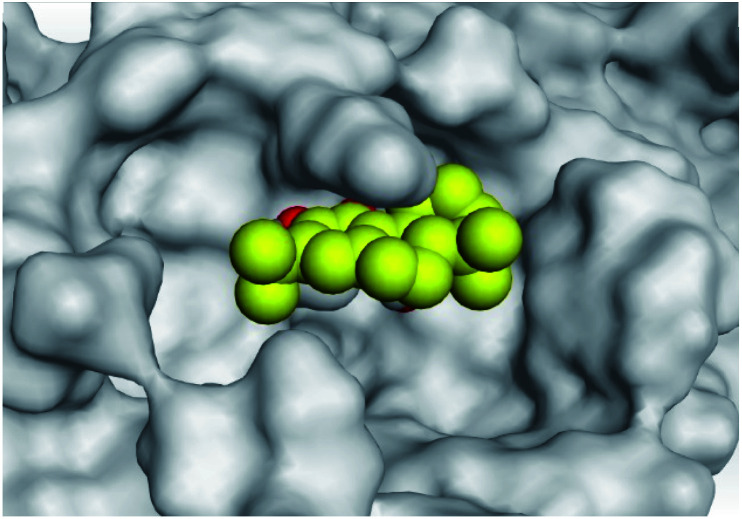
|
|
| 3 | S |
|
|
| Mpro |
|
|
|
| 4 | S |
|
|
| Mpro |
|
|
|
| 5 | S |
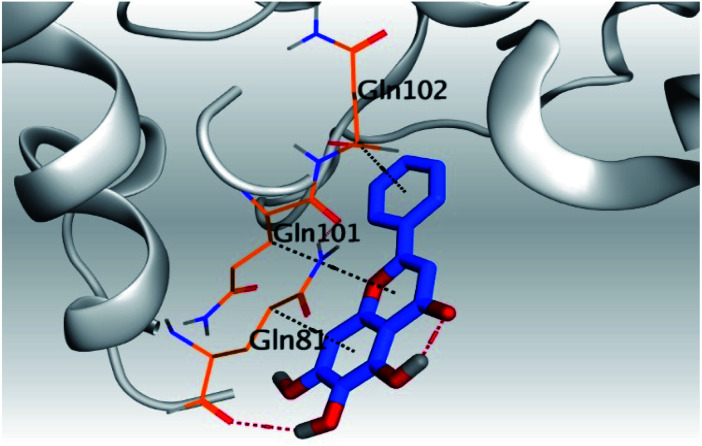
|
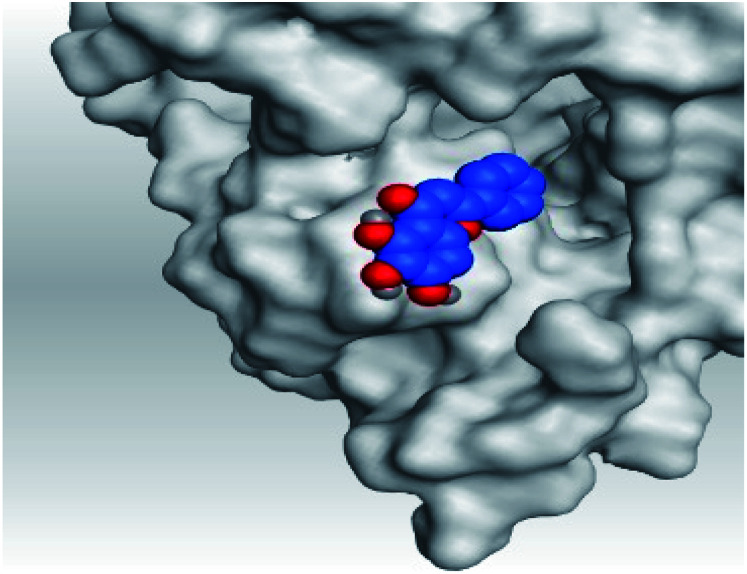
|
| Mpro |
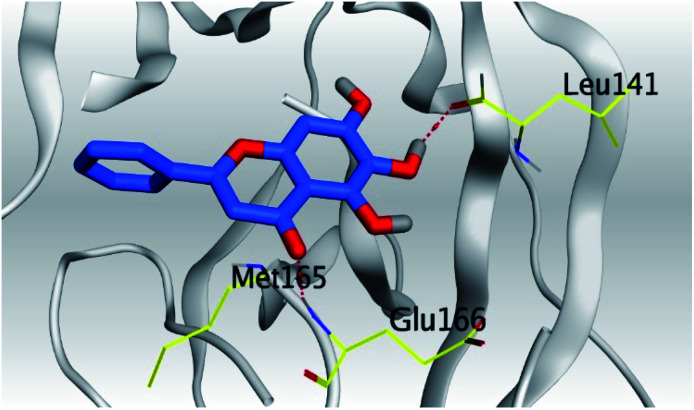
|
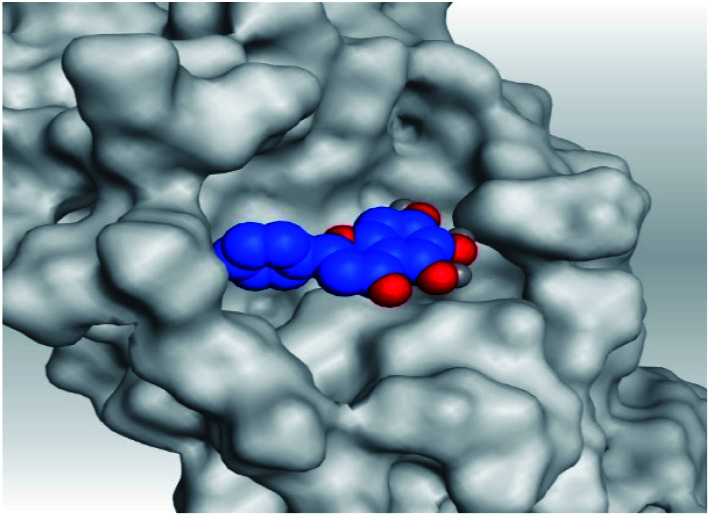
|
|
| 6 | S |
|
|
| Mpro |
|
|
|
| N3, 7 | Mpro |
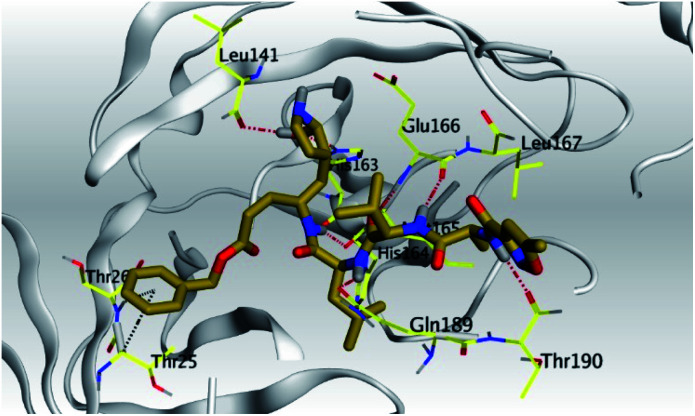
|
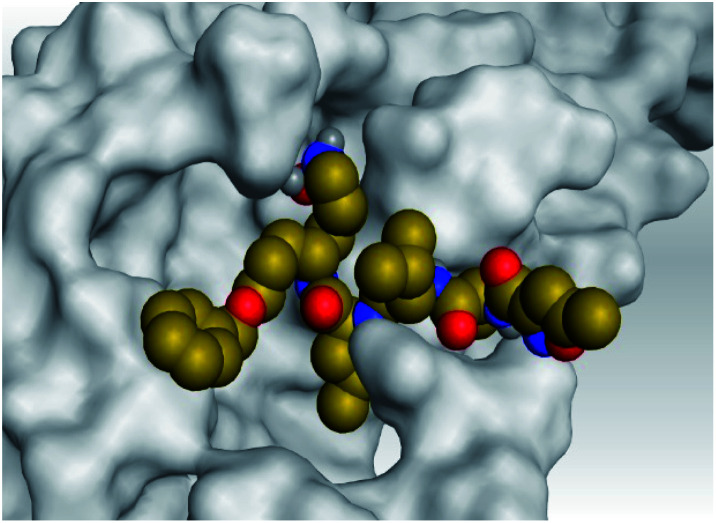
|
H-bonds were represented by red dashed lines while H-pi bonds by black ones.
