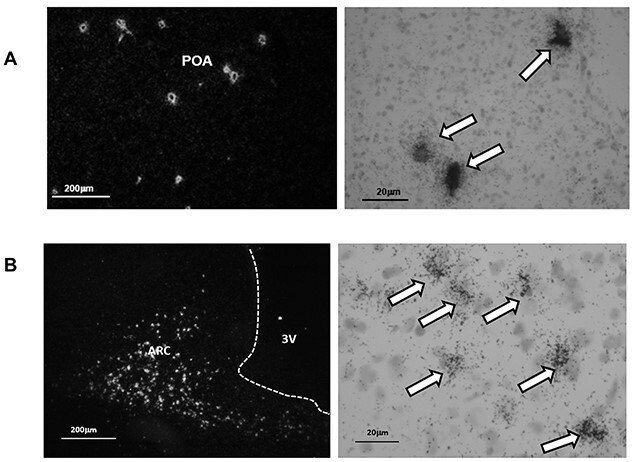
Figure 2.

ISH displayed GNRH1 and Kiss1 cells with minimal background labeling. Panel A: Example of GNRH1 expression in single cells of the preoptic area visualized by clusters of silver grains. Panel B: Example of Kiss1 expression in the arcuate nucleus. The left-hand images are low power visualization of cells under dark field and the right-hand images show silver grains over cells under light field and higher power (arrows).
