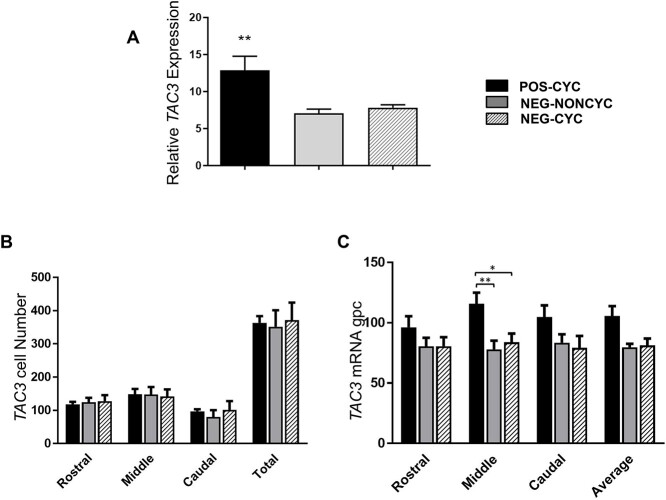
Figure 5.
Mean ± SEM expression of TAC3 in the ARC of POS-CYC (n = 7), NEG-NONCYC (n = 8), and NEG-CYC cows (n = 6). Panel A shows quantification by qPCR, being relative to the geometric mean of housekeeping genes. Panels B (number of cells) and C (expression/cell—silver grains/cell—gpc) show results from ISH. *P < 0.05, **P < 0.01. TAC3 expression was higher in POS cows when measured by qPCR, with higher expression/cell detected by ISH in cells of the mid-region of the ARC.

