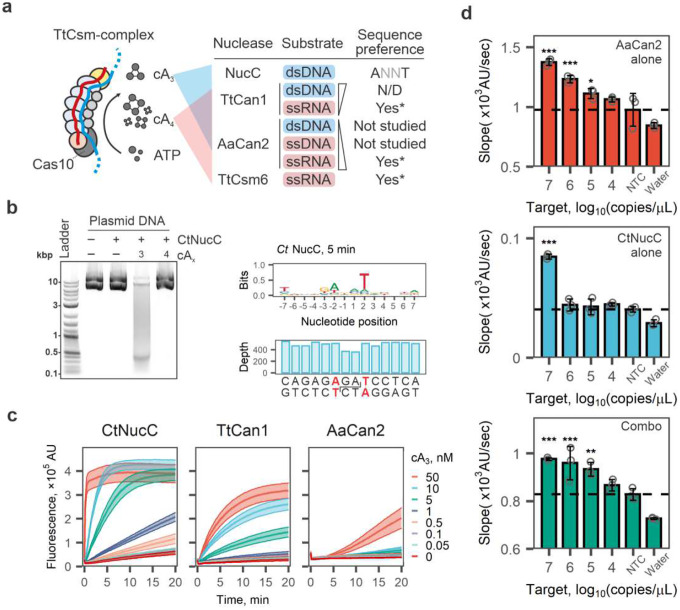
Fig. 3: Incorporation of cA3-activated nucleases into Csm-based RNA detection assay.
a The target bound TtCsm complex primarily generates cA4 and cA3. Schematics summarizes cA4- and cA3-dependent activities of nucleases biochemically tested. N/D – not detected; Asterisk (*) indicates nucleases that have sequences preferences (Supplementary Fig. 4). b Left panel: CtNucC (15 nM) is activated by cA3 (20 nM) and cleaves plasmid DNA into short fragments in 15 min. Right panel: The deep sequencing of DNA fragments generated after 5 min of incubation with CtNucC revealed the preferential cleavage sites (ANNT). The reduced sequencing depth at the cut site is consistent with a cleavage mechanism producing 3’-overhangs that are removed by T4 DNA polymerase when sequencing library is prepared. c CtNucC (300 nM), TtCan1 (300 nM) and AaCan2 (300 nM) cleavage assays with fluorescent dsDNA reporter across eight concentrations of cA3 (shown with colors). Data is shown as mean (center line) of three replicates ± S.E.M. (ribbon). d TtCsm RNA detection assays coupled with AaCan2 (ssRNA reporter), CtNucC (dsDNA reporter) and combination of AaCan2 and CtNucC (both reporters). Reactions were performed using samples with target RNA concentrations ranging from 107 to 102 copies/μL. Samples were prepared by spiking IVT fragment of SARS-CoV-2 N gene in total RNA of SARS-CoV-2 negative nasal swab. Cleavage of the fluorescent reporter was detected by measuring fluorescence every 10 sec in a real-time PCR instrument. Simple linear regression was used to determine slopes for 3 replicates. See Supplementary Fig. 8 for fluorescent curves used in the analysis. Data were plotted as mean (n = 3) ± S.D. and analyzed with one-way ANOVA. All samples were compared to the non-target RNA control (NTC) using one-tailed post-hoc Dunnett’s test. *** p < 0.001; ** p < 0.01; * p < 0.05.

