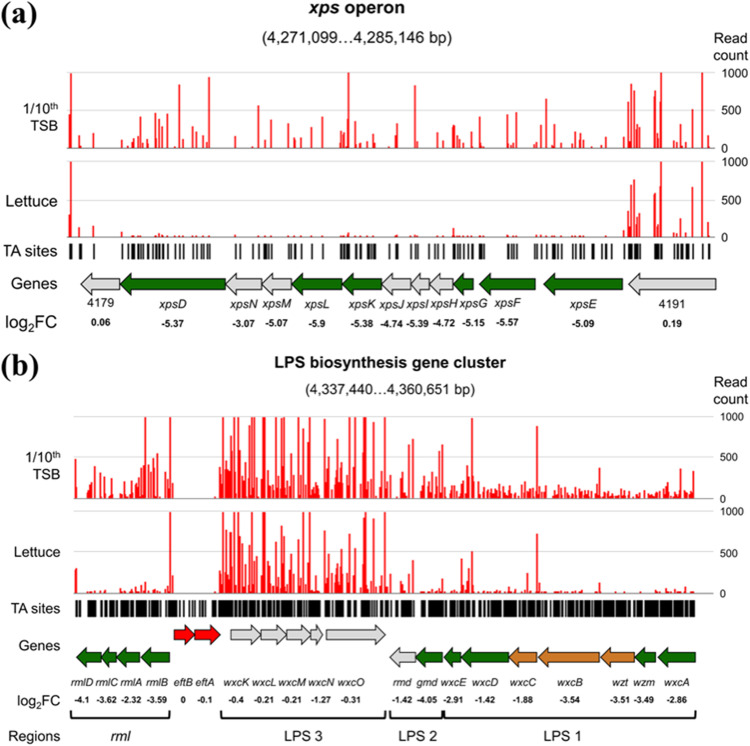
FIG 3.
Schematic representation of (a) the critical genes in lettuce within the xps T2SS operon and (b) the LPS biosynthesis gene cluster of X. hortorum pv. vitians LM16734. Numbers in brackets indicate the width of the viewing window on the LM16734 genome. Green arrows, critical genes in lettuce; gold arrows, critical genes in 1/10th TSB; red arrows, essential genes in the in vitro library; gray arrows, nonsignificant genes. Gene names, log2 FC values, and—for panel b—grouping in functional regions as described in reference 67 are displayed below. Black bars, localizations of TA sites; bar plots, read counts at each TA site under the control and experimental conditions. (Values of >1,000 are not displayed.)

