FIG 2.
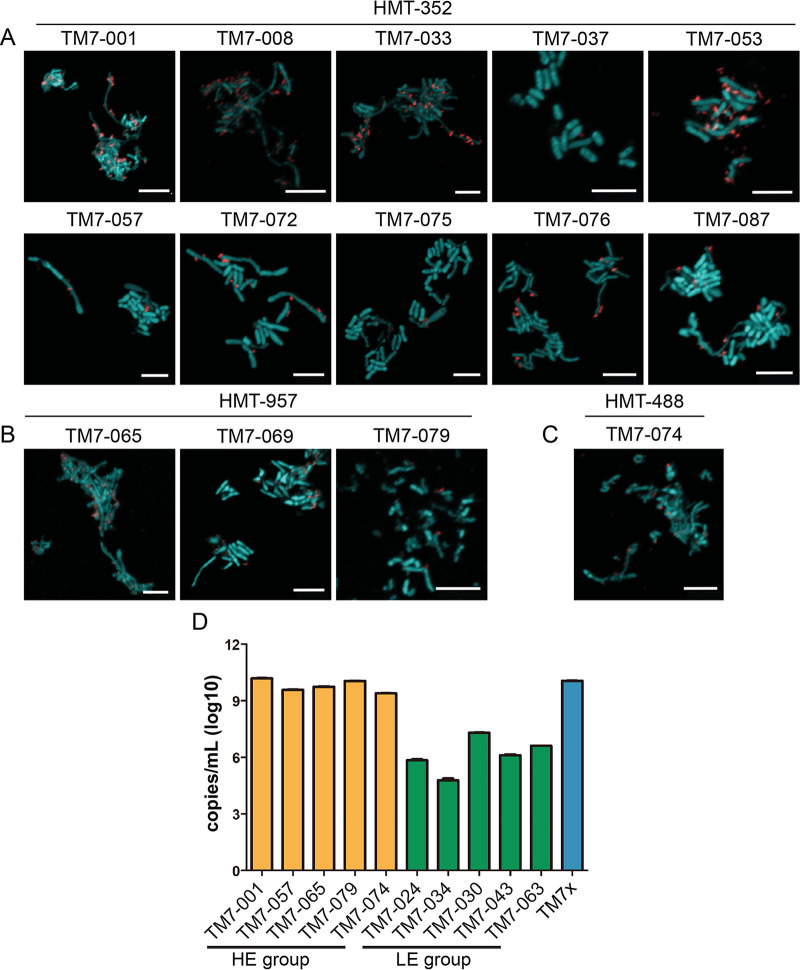
Different groups of isolated TM7. (A to C) FISH images of TM7 (red) and host bacteria (green) visualized by TM7-specific 16S rRNA probes. Basibionts were stained with Syto9 universal DNA dye. Only species in the HE group are shown by FISH. HMT-352 (A), HMT-957 (B), and HMT-488 (C) are illustrated by representative images. Scale bar, 5 μm. (D) qPCR reveals that copy numbers of TM7 16S per mL in the HE group (yellow bars) were ∼1,000 times greater than those in the LE group (green bars). In contrast, previously characterized TM7x is shown as the blue bar. Error bars indicate standard deviations.

