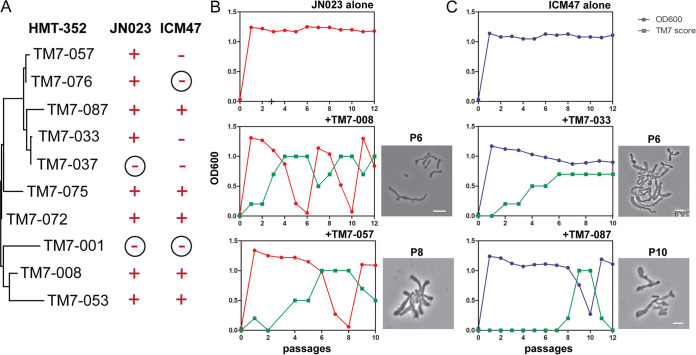
FIG 4.
HMT-352 strains induce a growth-crash phenotype in their basibionts. (A) Two different host bacteria (JN023 and ICM47) were infected with 10 different HMT-352 TM7 strains. Subsequently, the growth-crash phenotype of the hosts was determined by cell density (OD600 measurements). Plus signs represent strains that crashed, while minus signs represent those that did not crash. Circled minus signs signify strains that were not susceptible to TM7 infection and did not display the growth-crash phenotype. (B and C) Representative growth-crash graphs for select TM7 strains from Fig. S2 and S3. The x axis represents the passage numbers across time, while the y axis represents both cell density measurements (OD600, circles) and TM7 scores (squares). Phase-contrast images show each culture during the indicated passages (scale bar, 2 μm).

