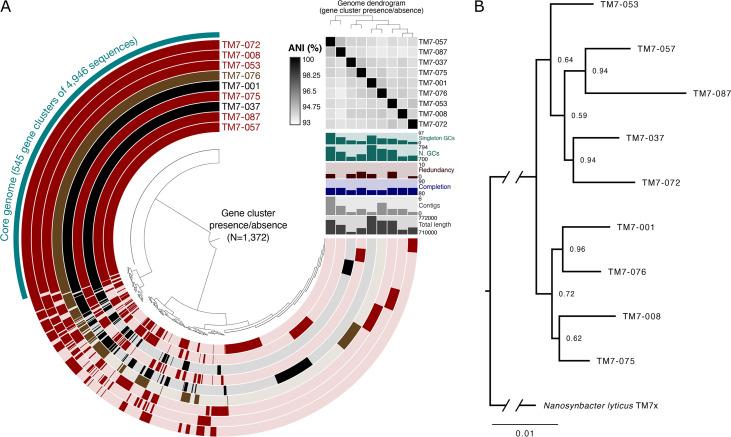
FIG 5.
Comparative genomic and phylogenomic analyses of HMT-352 strains. (A) Pangenome showing the distribution of homologous gene clusters (tips of central radial dendrogram, n = 1,372) across the nine HMT-352 genomes (270° layers). Gene clusters and layers are both ordered by presence/absence. Layers are colored in to mark gene clusters found in that genome or left with a translucent background if the gene cluster is absent from that genome. Layers are colored according to the strain’s host phenotype: red, crashed both JN023 and ICM47; black, crashed neither; brown, crashed one. Relevant statistics for each genome (length, number of contigs, completion and redundancy, number of gene clusters, and number of singleton gene clusters) are shown in vertical bar charts extending from the 3 o’clock portion of the figure. The black and white heatmap shows pairwise average nucleotide identity (ANI) for all alignable fractions. (B) Phylogenomic tree constructed with 60 concatenated core proteins from the nine genomes shown in panel A with TM7x (HMT-952) included as an outgroup. Node labels represent bootstrap support.

