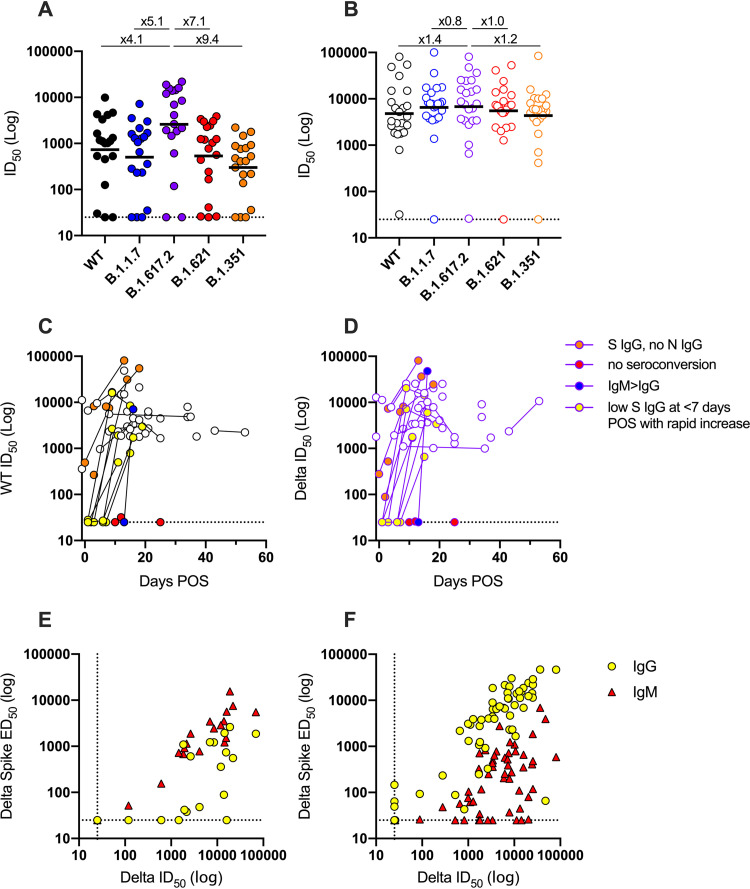
FIG 2.
Differences in neutralizing antibody response between Delta-infected individuals and COVID-19-vaccinated individuals experiencing Delta breakthrough infection. (A and B) ID50 of neutralization against WT (black) and VOCs Alpha (B.1.1.7, blue), Delta (B.1.617.2, purple), Mu (B.1.621, red), and Beta (B.1.351, orange) for sera from (A) SARS-CoV-2 vaccine-naive, Delta-infected individuals and (B) BTI individuals. Samples were collected 12 to 22 days POS. Black lines show the GMT. Fold decreases in GMT compared to Delta are shown above. Neutralization assays were carried out in duplicate. (C and D) Longitudinal neutralization potency of sera from BTI individuals against (C) WT pseudovirus particles and (D) Delta pseudovirus particles. Donors with IgM > IgG are shown in blue, donors who did not seroconvert are shown in red, donors with high Spike IgG but no N IgG at <7 days POS are shown in orange, and donors with low Spike IgG at <7 days POS that rapidly increased are shown in yellow. Data for the Alpha, Beta, and Mu VOCs are shown in Fig. S2A. (E and F) Correlation (Spearman, r) between ID50 of neutralization and IgM or IgG ED50 for Delta spike binding for (E) Delta-infected individuals (IgM: r = 0.92, r2 = 0.90, P < 0.0001; IgG: r = 0.66, r2 = 0.43, P = 0.001) and (F) COVID-19-vaccinated individuals experiencing breakthrough infection (IgM: r = 0.61, r2 = 0.38, P < 0.0001; IgG: r = 0.83, r2 = 0.75, P < 0.0001). A linear regression was used to calculate the goodness of fit (r2). The dotted lines represent the lowest serum dilution used in each assay. IgG is shown with yellow circles, and IgM is shown with red triangles.

