
FIG 1.
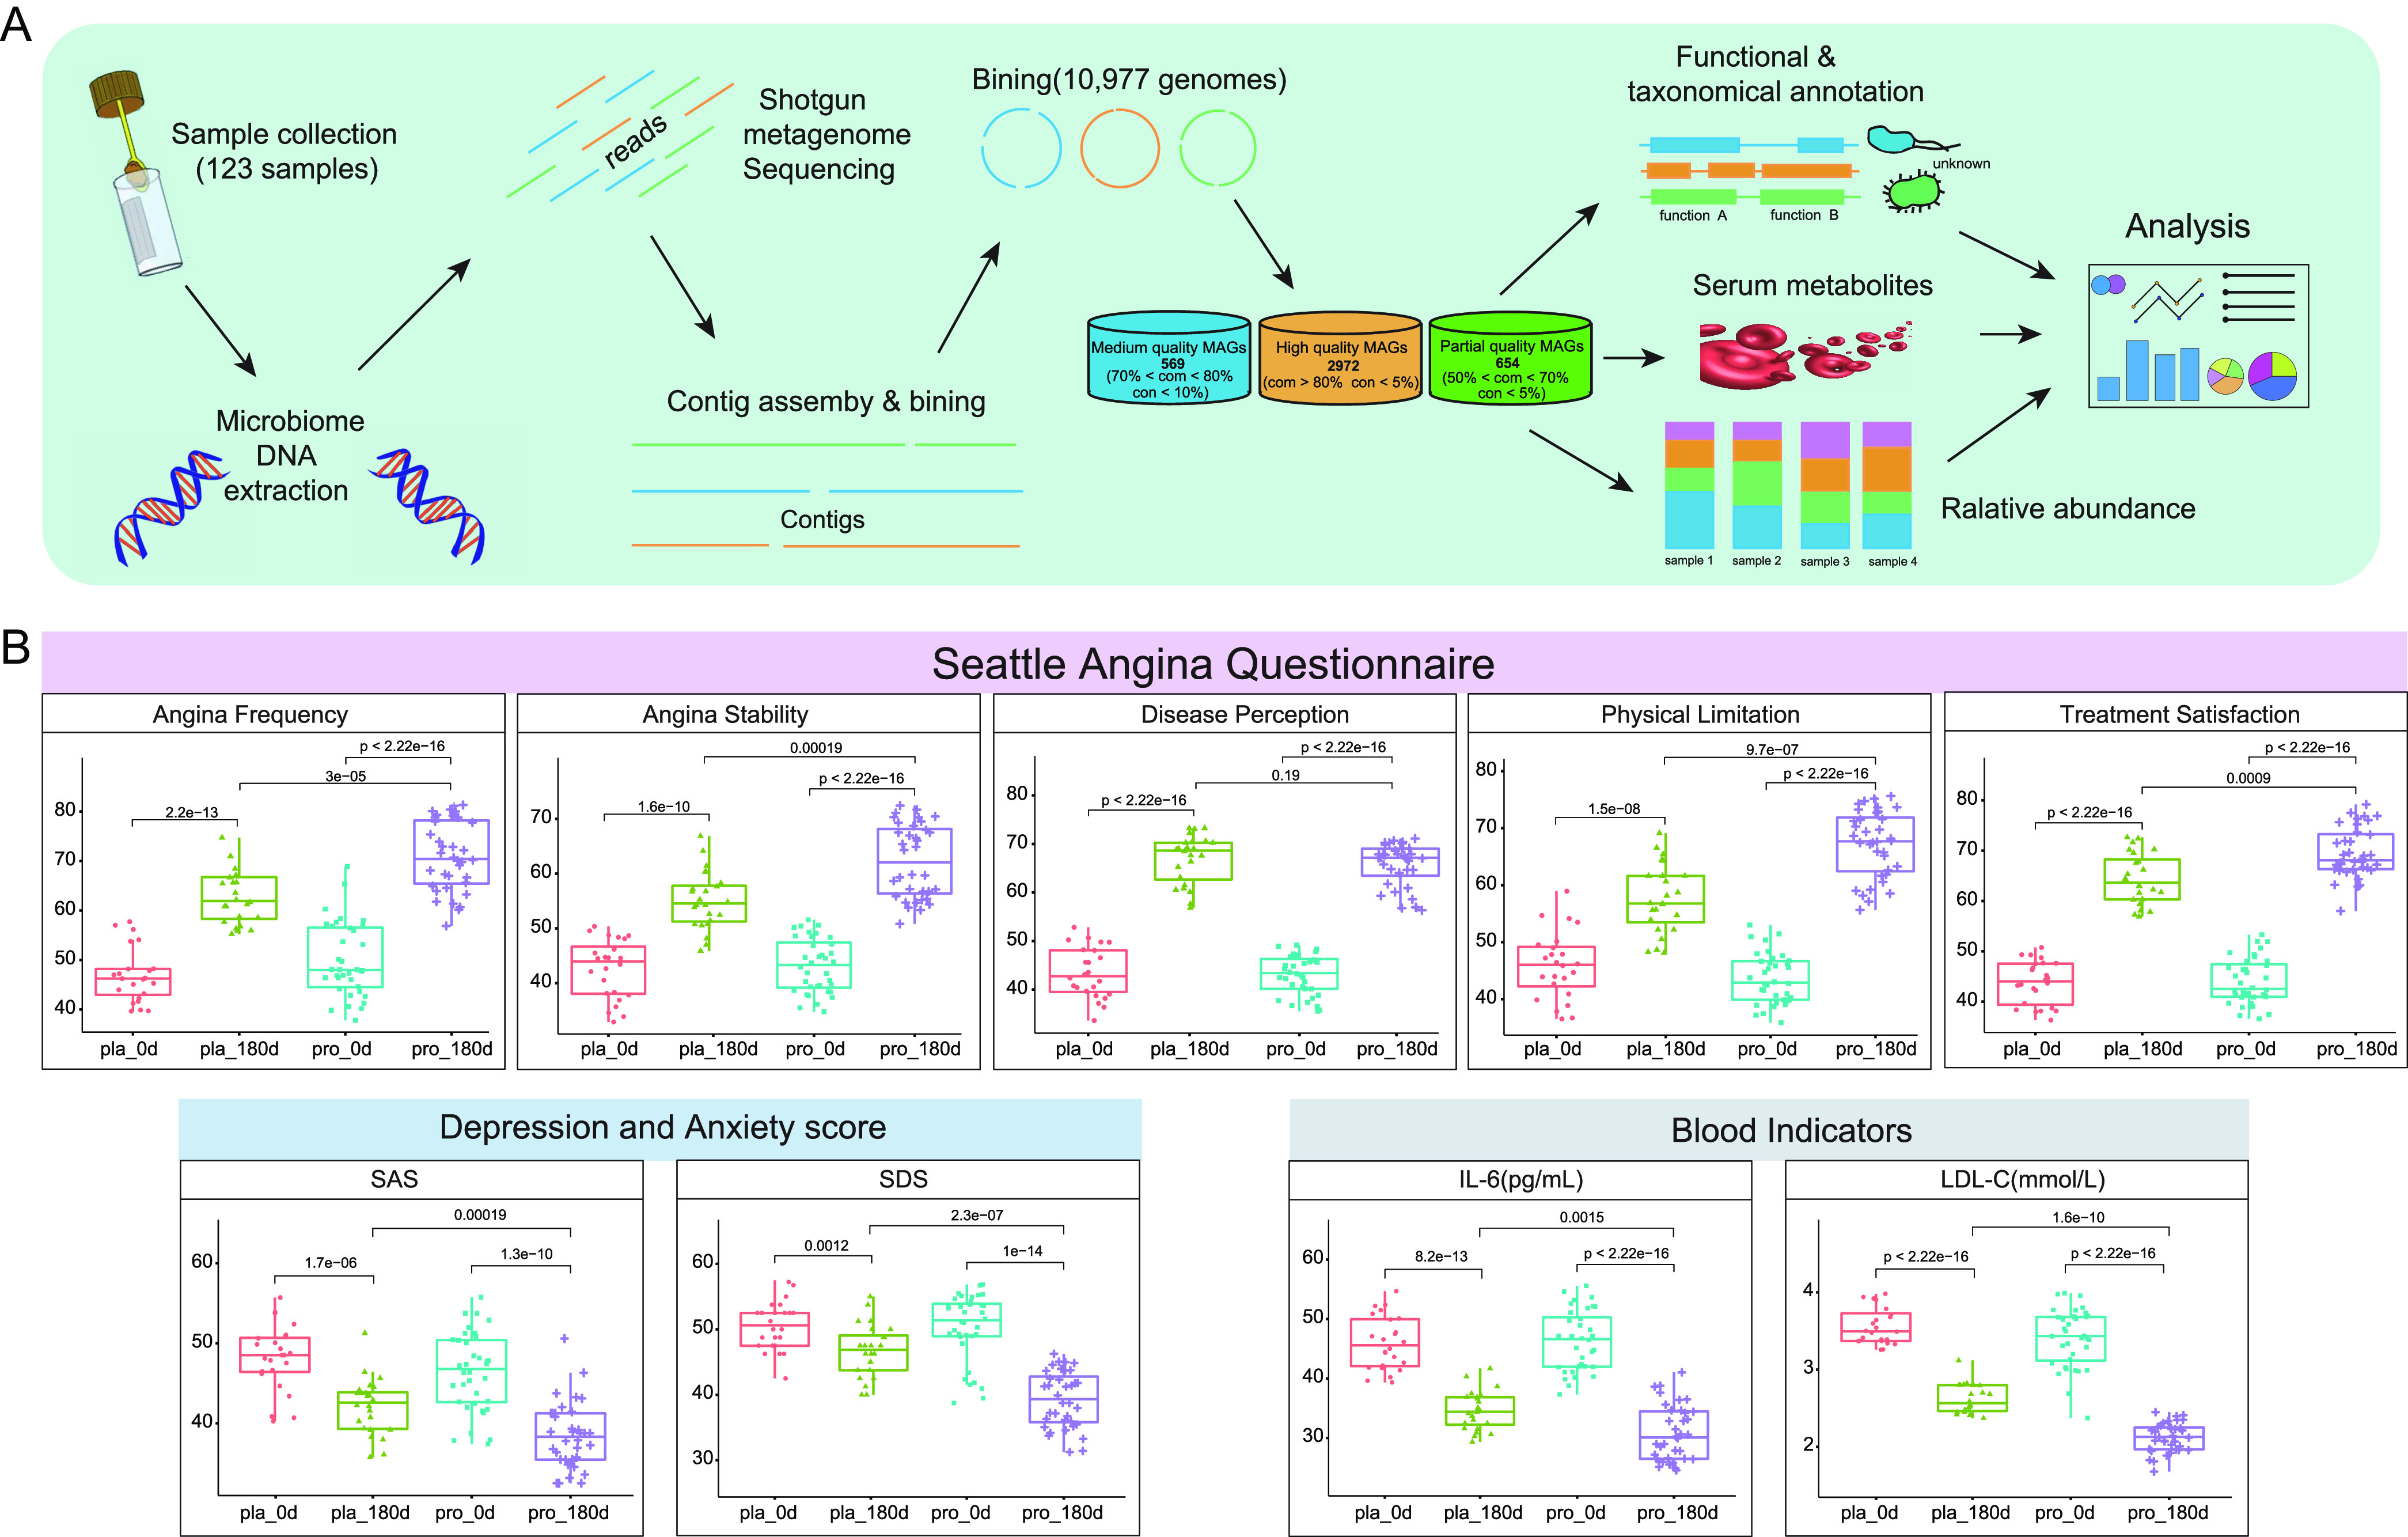
Clinical indicators of coronary artery disease-associated symptoms and multiomics analysis pipeline. (A) The workflow of microbial community composition, functional taxonomical annotation, and serum metabolome multiomics analysis. A total of 2,972 high-quality metagenome-assembled genomes (MAGs) were identified in the complete data set. “com” and “con” represent levels of completeness and contamination, respectively. Statistical differences were analyzed using the Wilcoxon test or t test. (B) Statistical differences in clinical indicators were evaluated by the Wilcoxon test (for horizontal comparison between probiotic and placebo groups; n = 36 and 24, respectively) or paired t test (for longitudinal comparison between days 0 and 180), respectively. Benjamini-Hochberg procedure was applied to correct for multiple testing in all cases and corrected P < 0.05 was considered statistically significant. Abbreviations: SAS=Self-Rating Anxiety Scale scores; SDS=Self-Rating Depression Scale scores; IL-6 = interleukin-6; LDL-C = low-density lipoprotein cholesterol.