
FIG 2.
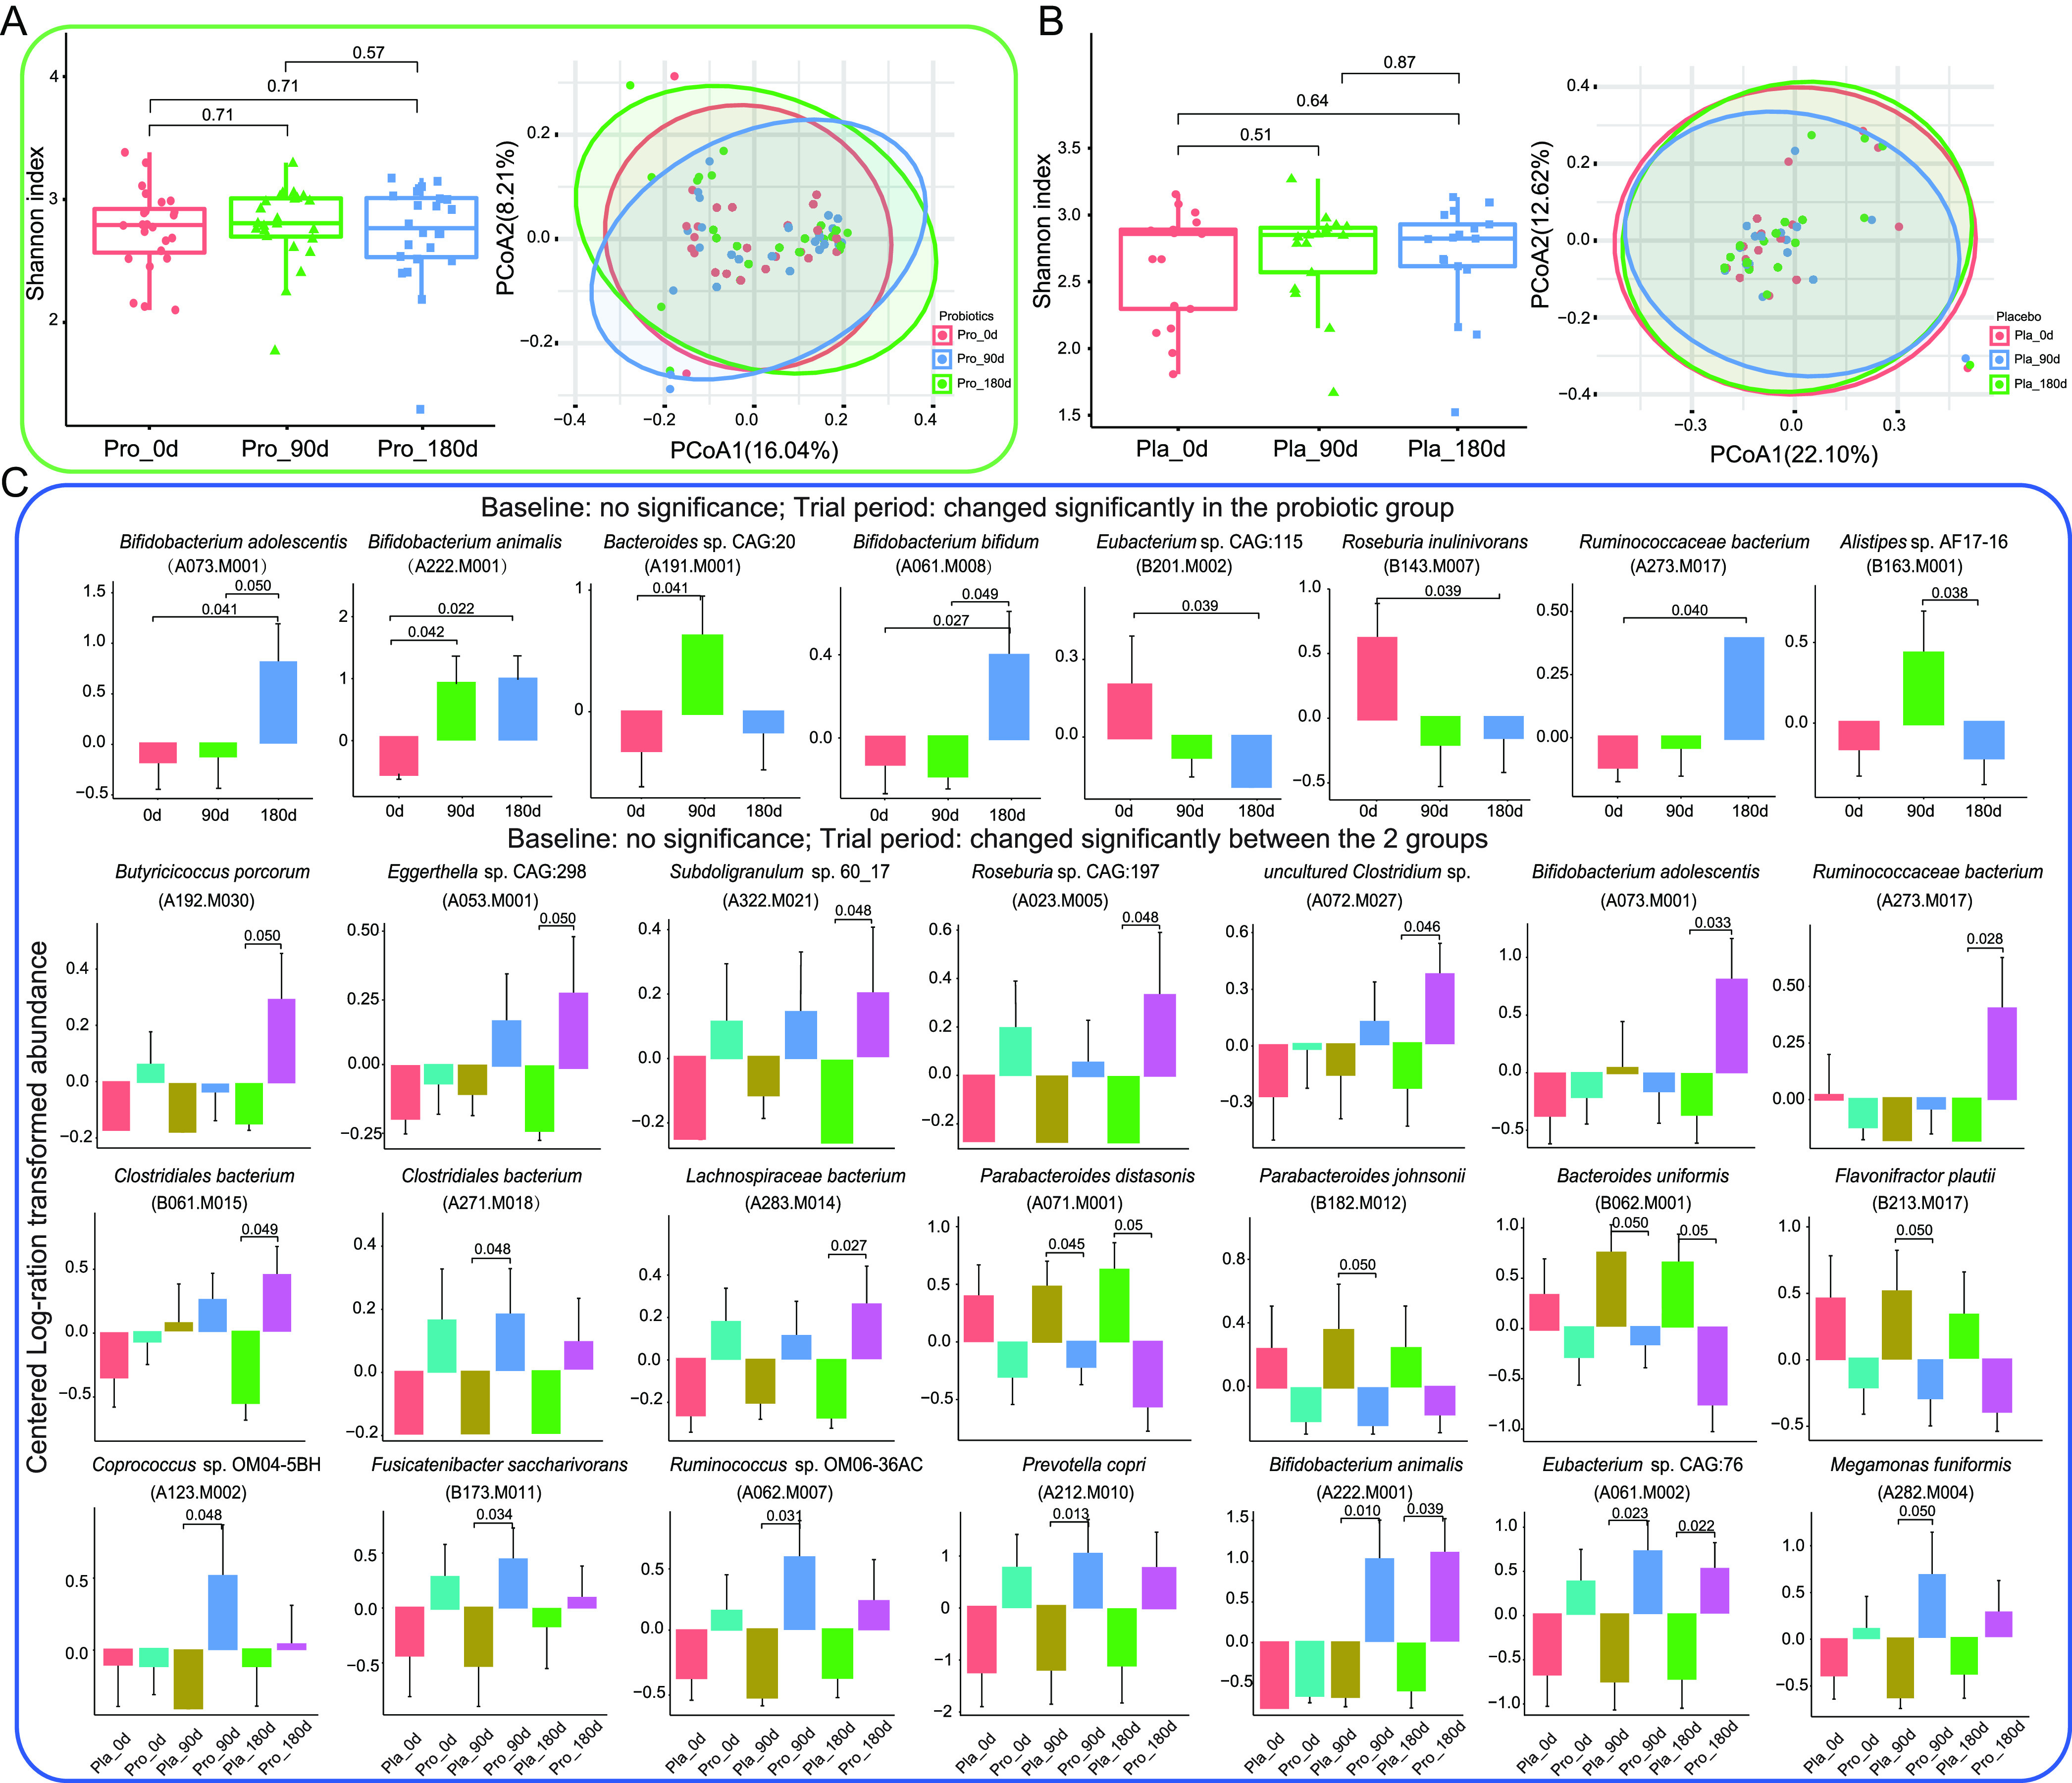
Microbial diversity and species-level genome bins (SGBs) features of fecal metagenome data set of patients. Shannon diversity index and principal coordinates analysis (PCoA) score plots of the probiotic (A) and placebo (B) groups at days 0 (0d), 90 (90d), and 180 (180d). Symbols representing samples of the probiotic and placebo groups at different time points are shown in different colors. (C) Dramatic changed SGBs between probiotic and placebo groups at different time points. A total of 41 patients (probiotic group, n = 24; placebo group, n = 17) donated fecal samples at three consecutive time points for fecal metagenomics analysis. Statistical analysis was performed with the Wilcoxon test with correction for multiple testing using the Benjamini-Hochberg procedure and corrected P < 0.05 was considered statistically significant.