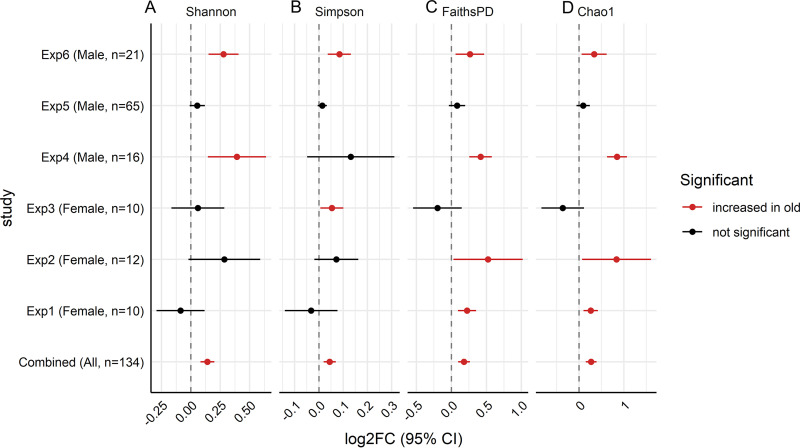
FIG 2.
Forest plots of alpha diversity metrics. Shannon (A), Simpson (B), Faith’s PD (C), and Chao1 (D) indices demonstrated an increase in alpha diversity in response to aging. Analysis of the combined data sets was performed using a linear mixed-effects model using the formula log2FC ∼ age + (1|study). A P value of <0.05 was considered statistically significant.

