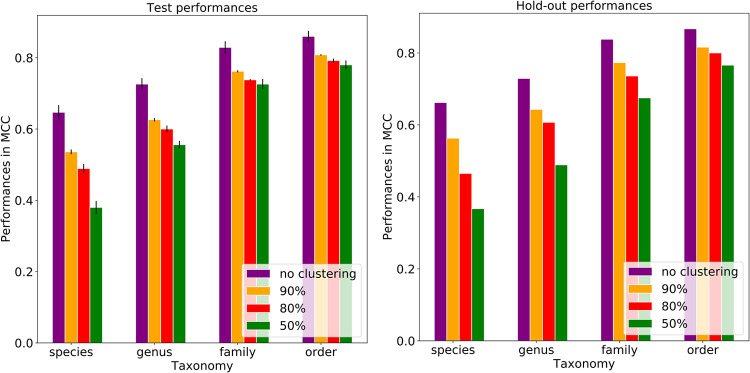
FIG 4.
Effects of clustering plasmids at different k-mer similarity thresholds on the plasmid host predictions using 8-mers and different taxonomic levels. Each bar represents the model performance per taxonomic level, and each error bar represents the standard deviation across folds. The plot shows the influence of plasmid sequence similarity on prediction performances in MCCs from the species to order level. The plots suggested that the prediction models pick up sequence similarity mostly at lower taxonomic levels. When the dissimilarity was increased between the training, test, and hold-out data sets by applying the 80% k-mer similarity threshold, 7.7% to 29.8% losses in MCC performance were observed for the hold-out data.

