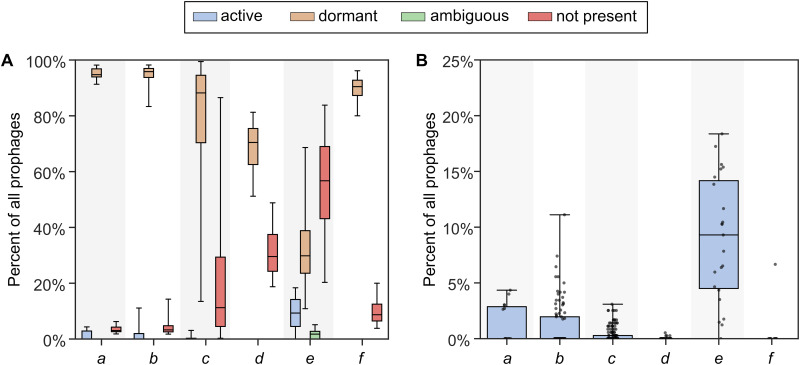
FIG 4.
Percent of prophages by activity category in metagenomic samples. (A and B) Five sets of metagenomic samples are compared with all activity categories (A) and only the active prophage category (B). For panel B, each dot represents a single sample. Identifier labels a to f on the x-axis correspond to the final column, “Label,” in Table 1.

