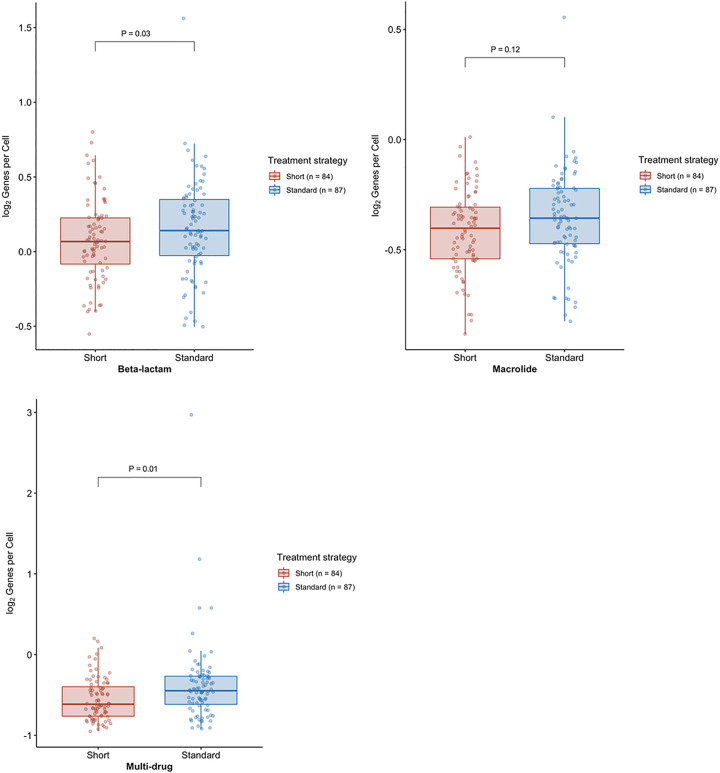
FIG 2.
Boxplot of beta-lactam, macrolide, and multidrug efflux resistance genes per prokaryotic cell (RGPC) in throat swabs from 171 participants at the end of the study. The boxplots depict the distribution of RGPC for beta-lactam (top left), macrolide (top right), and multidrug efflux (bottom left) resistance genes. The line reflects the median RGPC, lower and upper hinges correspond to the first and third quartiles, respectively, and upper and lower whiskers extend from the hinge to the highest value that is within 1.5× interquartile range of the hinge. A one-sided Wilcoxon rank sum test was used to assess statistically significant differences (alpha level <0.05) between the numbers of RGPC in participants assigned to a short course (red) or standard course (blue) strategy. Log2 normalized RGPC data were used for visualization.

